

Classification of parenchymal abnormality in scleroderma lung using a novel approach to denoise images collected via a multicenter study
- PMID: 18620121
- PMCID: PMC2584616
- DOI: 10.1016/j.acra.2008.03.011
Classification of parenchymal abnormality in scleroderma lung using a novel approach to denoise images collected via a multicenter study
Abstract
Rationale and objectives: Computerized classification techniques have been developed to offer accurate and robust pattern recognition in interstitial lung disease using texture features. However, these techniques still present challenges when analyzing computed tomographic (CT) image data from multiprotocols because of disparate acquisition protocols or from standardized, multicenter clinical trials because of noise variability. Our objective is to investigate the utility of denoising thin section CT image data to improve the classification of scleroderma disease patterns. The patterns are lung fibrosis (LF), groundglass (GG), honeycomb (HC), or normal lung (NL) within small regions of interest (ROIs).
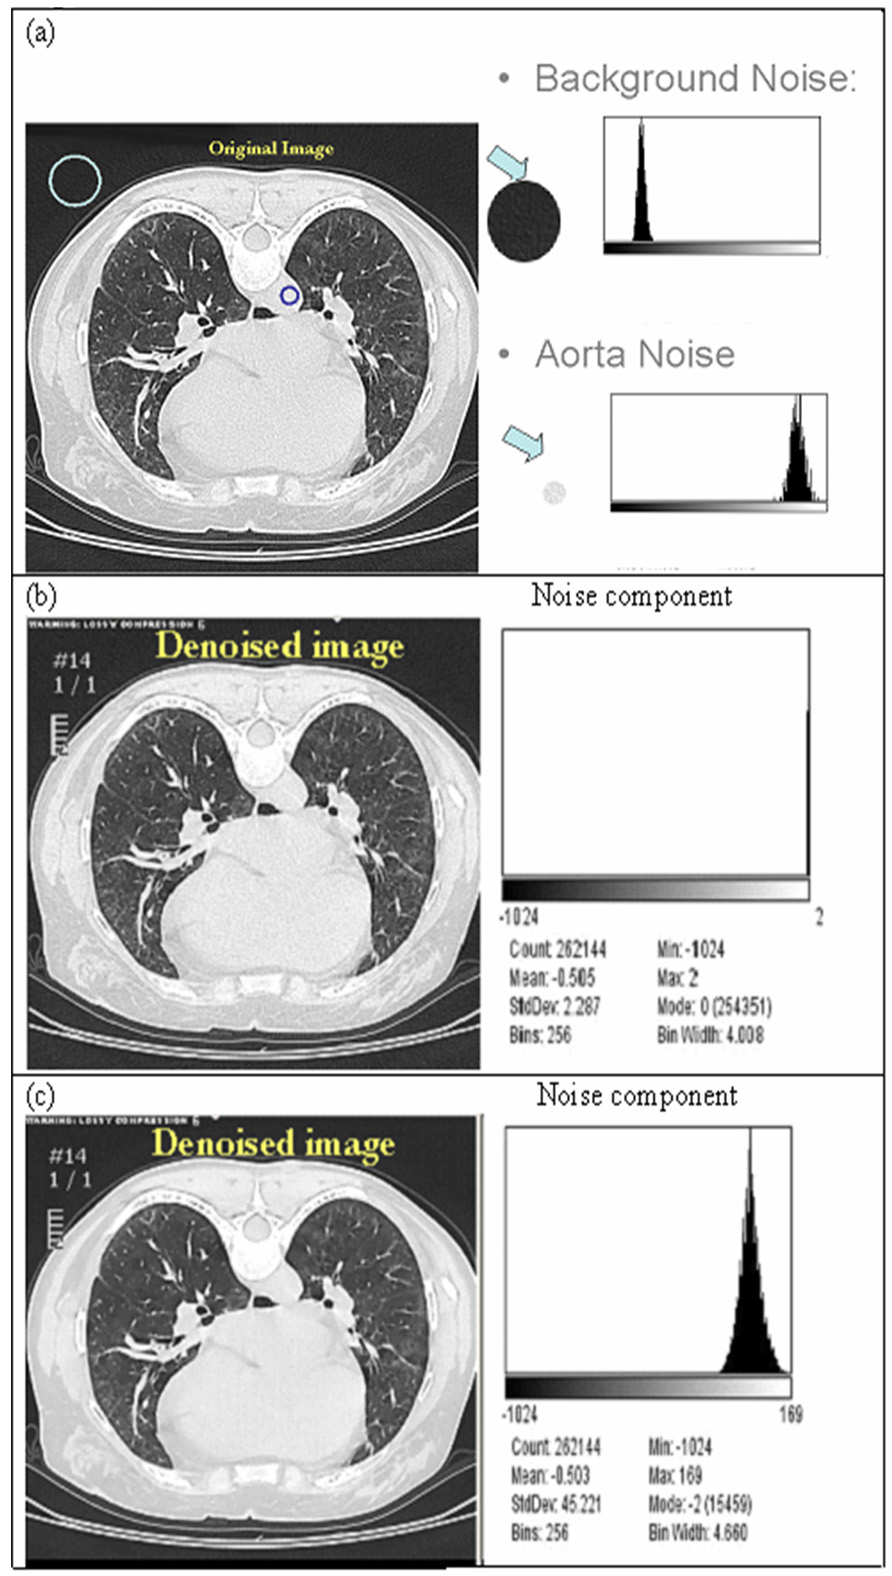
Methods: High-resolution CT images were scanned in a multicenter clinical trial for the Scleroderma Lung Study. A thoracic radiologist contoured a training set (38 patients) consisting of 148 ROIs with 46 LF, 85 GG, 4 HC, and 13 NL patterns and contoured a test set (33 new patients) consisting of 132 ROIs with 44 LF, 72 GG, 4 HC, and 12 NL patterns. The corresponding CT slices of a contoured ROI were denoised using Aujol's mathematic partial differential equation algorithm. The algorithm's noise parameter was estimated as the standard deviation of grey-level signal (in Hounsfield units) in a homogeneous, non-lung region: the aorta. Within each contoured ROI, every pixel within a 4 x 4 neighborhood was sampled (4 x 4 grid sampling). All sampled pixels from a contoured ROI were assumed to be the same disease pattern as labeled by the radiologist. 5,690 pixels (3,009 LF, 1,994 GG, 348 HC, and 339 NL) and 5,045 pixels (2,665 LF, 1,753 GG, 291 HC, and 336 NL) were sampled in training and test sets, respectively. Next, 58 texture features from the original and denoised image were calculated for each pixel. Using a multinomial logistic model, subsets of features (one from original and another from denoised images) were selected to classify disease patterns. Finally, pixels were classified into disease patterns using a support vector machine procedure.
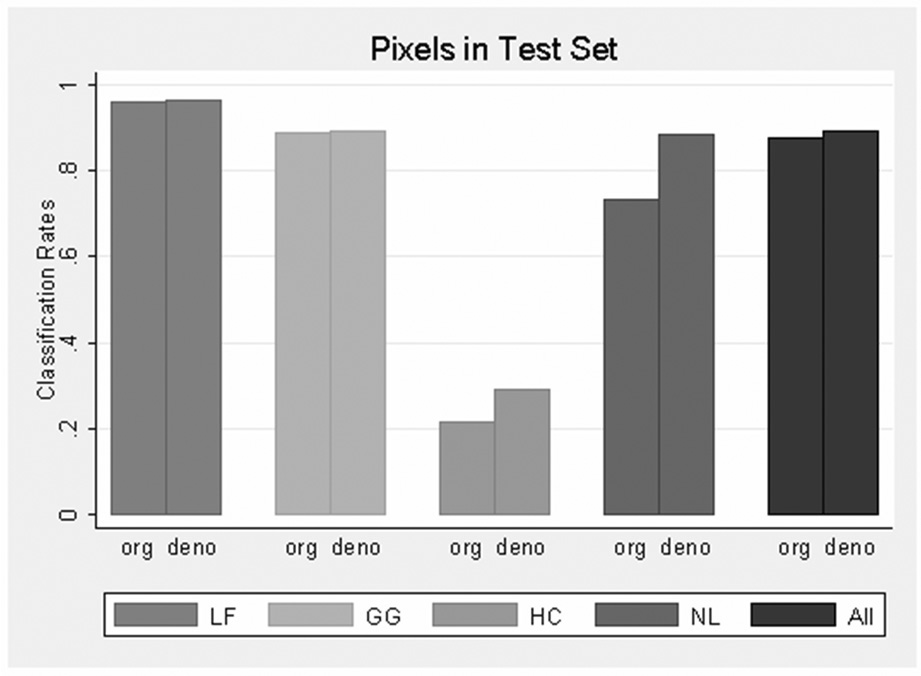
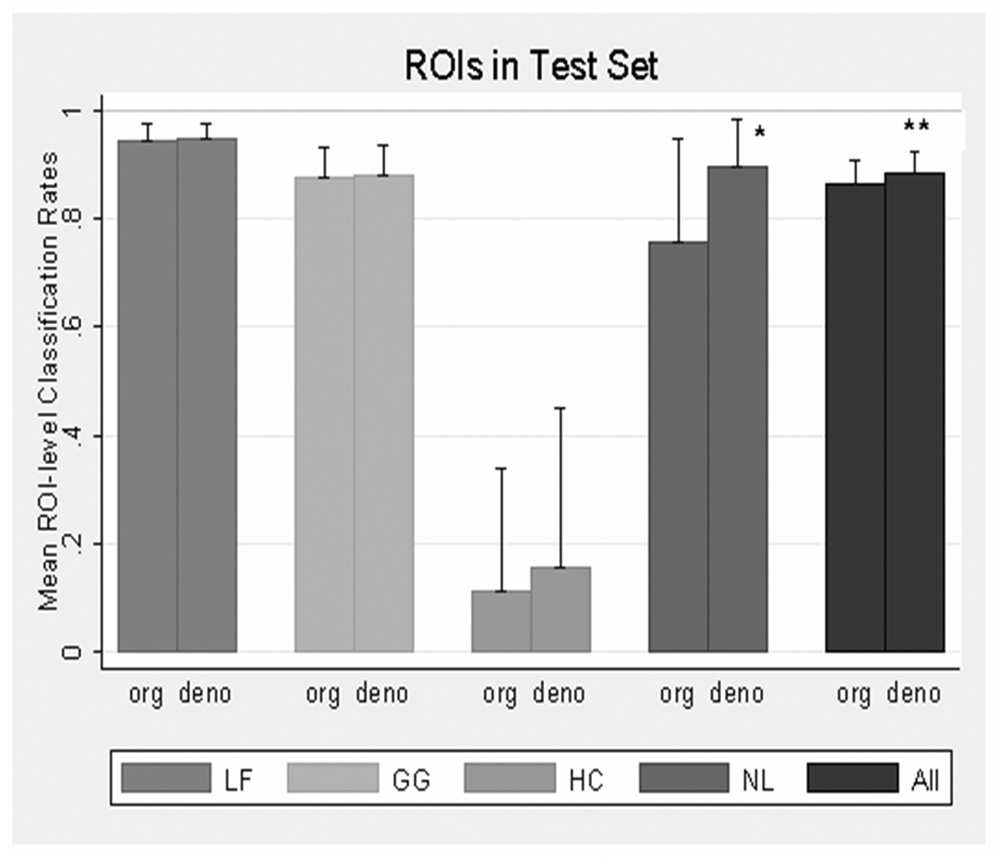
Results: From the training set, multinomial logistic model selected 45 features from the original images and 38 features from denoised images to classify disease patterns. Using the test set, the overall pixel classification rate by SVM increased from 87.8% to 89.5% with denoising. The specific classification rates (original/denoised) were 96.3/96.4% for LF, 88.8/89.4% for GG, 21.3/28.9% for HC, and 73.5/88.4% for NL. Denoising significantly improved the NL and overall classification rates (P = .037 and P = .047 respectively) at ROI level.
Conclusions: Analyzing multicenter data using a denoising approach led to more parsimonious classification models with increasing accuracy. This approach offers a novel alternate classification strategy for heterogeneous technical and disease components. Furthermore, the model offers the potential to discriminate the multiple patterns of scleroderma disease correctly.
Figures
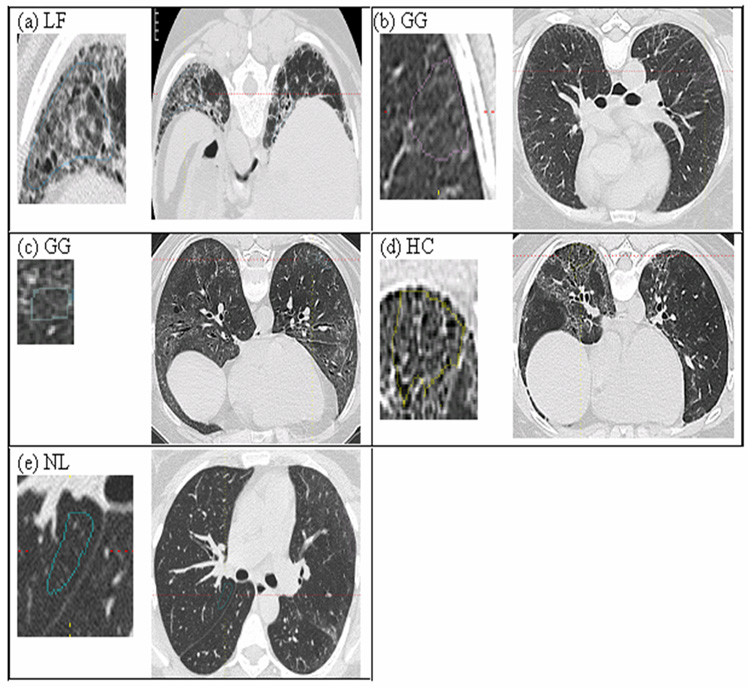
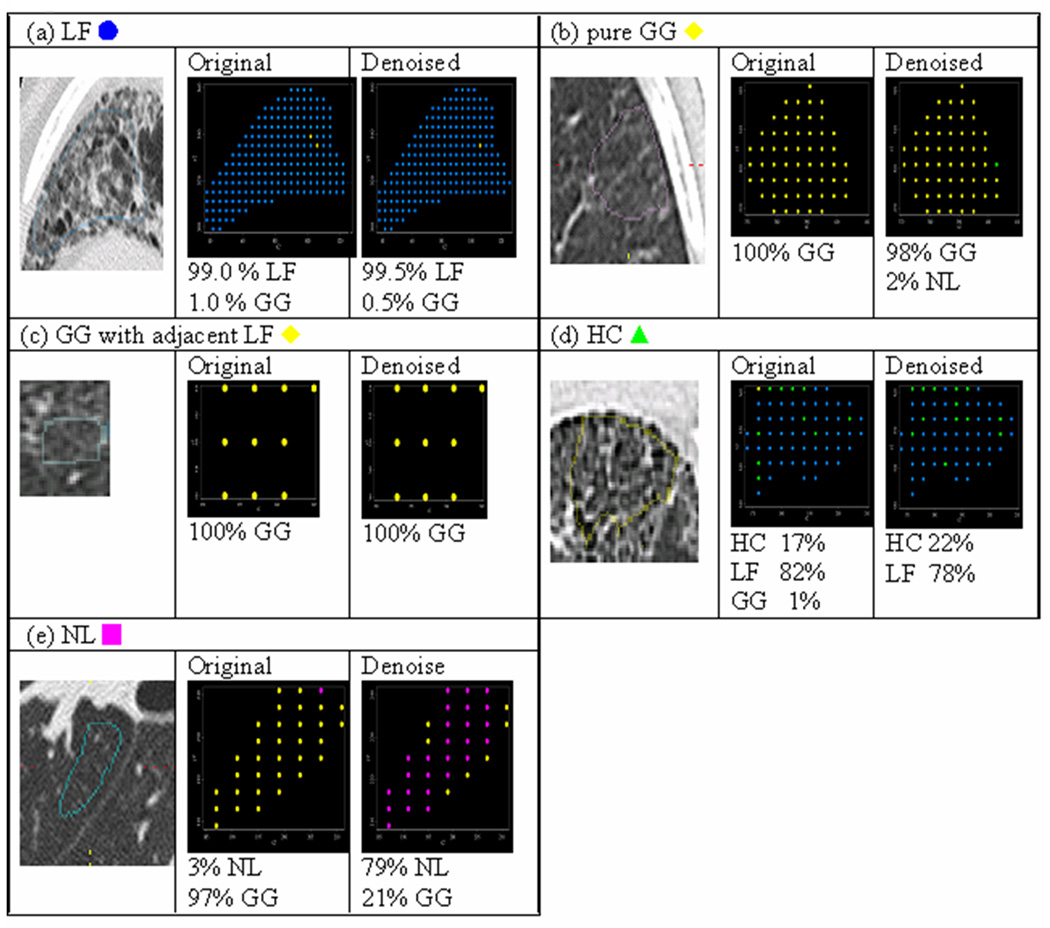
 , GG
, GG  , HC
, HC  , NL
, NL  . Note that image sizes were rescaled subjectively. Each dot represented the same size of pixel, which was sampled by rule of one out of 4-by-4 neighboring pixels.
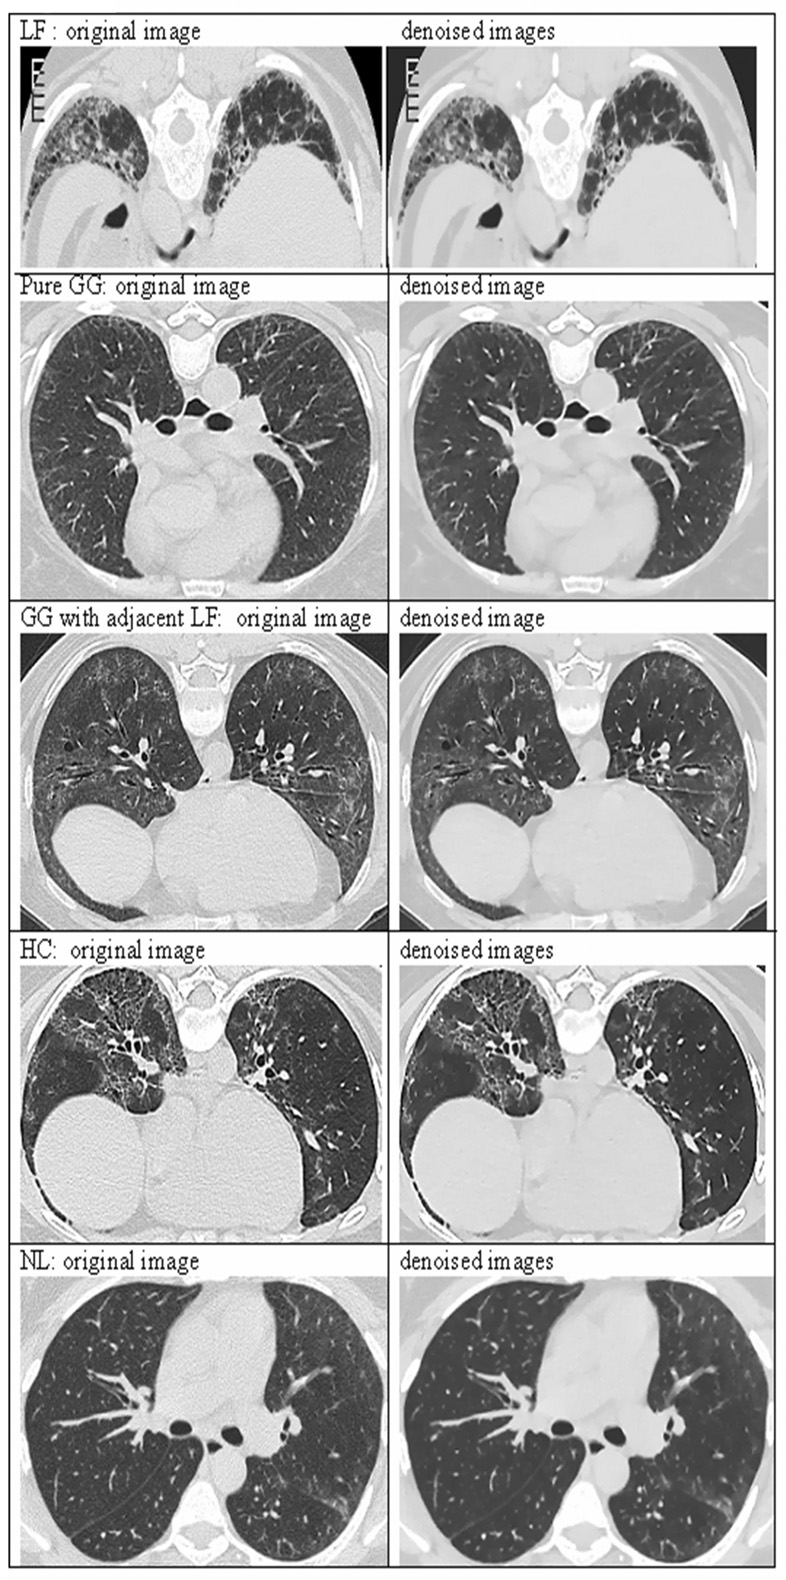
Similar articles
-
A support vector machine classifier reduces interscanner variation in the HRCT classification of regional disease pattern in diffuse lung disease: comparison to a Bayesian classifier.Med Phys. 2013 May;40(5):051912. doi: 10.1118/1.4802214. Med Phys. 2013. PMID: 23635282
-
Effective staging of fibrosis by the selected texture features of liver: Which one is better, CT or MR imaging?Comput Med Imaging Graph. 2015 Dec;46 Pt 2:227-36. doi: 10.1016/j.compmedimag.2015.09.003. Epub 2015 Sep 18. Comput Med Imaging Graph. 2015. PMID: 26455963
-
Computer-aided classification of interstitial lung diseases via MDCT: 3D adaptive multiple feature method (3D AMFM).Acad Radiol. 2006 Aug;13(8):969-78. doi: 10.1016/j.acra.2006.04.017. Acad Radiol. 2006. PMID: 16843849
-
Feasibility of automated quantification of regional disease patterns depicted on high-resolution computed tomography in patients with various diffuse lung diseases.Korean J Radiol. 2009 Sep-Oct;10(5):455-63. doi: 10.3348/kjr.2009.10.5.455. Epub 2009 Aug 25. Korean J Radiol. 2009. PMID: 19721830 Free PMC article.
-
Imaging and lung disease: uses and interpretation.Tuber Lung Dis. 1993 Jun;74(3):147-58. doi: 10.1016/0962-8479(93)90003-G. Tuber Lung Dis. 1993. PMID: 8369507 Review.
Cited by
-
Treatment of scleroderma-interstitial lung disease with cyclophosphamide is associated with less progressive fibrosis on serial thoracic high-resolution CT scan than placebo: findings from the scleroderma lung study.Chest. 2009 Nov;136(5):1333-1340. doi: 10.1378/chest.09-0108. Chest. 2009. PMID: 19892673 Free PMC article. Clinical Trial.
-
IL-6 trans-signaling in a humanized mouse model of scleroderma.Proc Natl Acad Sci U S A. 2023 Sep 12;120(37):e2306965120. doi: 10.1073/pnas.2306965120. Epub 2023 Sep 5. Proc Natl Acad Sci U S A. 2023. PMID: 37669366 Free PMC article.
-
Quantitative Computed Tomography Lung COVID Scores with Laboratory Markers: Utilization to Predict Rapid Progression and Monitor Longitudinal Changes in Patients with Coronavirus 2019 (COVID-19) Pneumonia.Biomedicines. 2024 Jan 6;12(1):120. doi: 10.3390/biomedicines12010120. Biomedicines. 2024. PMID: 38255225 Free PMC article.
-
Large-Scale Characterization of Systemic Sclerosis Serum Protein Profile: Comparison to Peripheral Blood Cell Transcriptome and Correlations With Skin/Lung Fibrosis.Arthritis Rheumatol. 2021 Apr;73(4):660-670. doi: 10.1002/art.41570. Epub 2021 Feb 28. Arthritis Rheumatol. 2021. PMID: 33131208 Free PMC article.
-
Correlation of delta high-resolution computed tomography (HRCT) score with delta clinical variables in early systemic sclerosis (SSc) patients.Quant Imaging Med Surg. 2016 Aug;6(4):381-390. doi: 10.21037/qims.2016.08.08. Quant Imaging Med Surg. 2016. PMID: 27709074 Free PMC article.
References
-
- Best AC, Lynch AM, Bozic CM, et al. Quantitative CT indexes in idiopathic pulmonary fibrosis: relationship with physiologic impairment. Radiology. 2003;228:407–414. - PubMed
-
- Lynch DA. Quantitative CT of fibrotic interstitial lung disease. Chest. 2007;131:643–644. - PubMed
-
- Uppaluri R, Hoffman EA, Sonka M, et al. Computer recognition of regional lung disease patterns. Am J Respir Crit Care Med. 1999;160:648–654. - PubMed
-
- Chabat F, Yang GZ, Hansell DM. Obstructive lung diseases: texture classification for differentiation at CT. Radiology. 2003;228:871–877. - PubMed
-
- Kim KG, Goo JM, Kim JH, et al. Computer-aided diagnosis of localized ground-glass opacity in the lung at CT: initial experience. Radiology. 2005;237:657–661. - PubMed
Publication types
MeSH terms
Grants and funding
LinkOut - more resources
Full Text Sources
Other Literature Sources
Medical
