. 2008 Jul 17;4(1):52-62.
doi: 10.1016/j.chom.2008.06.002.

Duffy antigen receptor for chemokines mediates trans-infection of HIV-1 from red blood cells to target cells and affects HIV-AIDS susceptibility

Affiliations

Duffy antigen receptor for chemokines mediates trans-infection of HIV-1 from red blood cells to target cells and affects HIV-AIDS susceptibility

Weijing He et al. Cell Host Microbe. .

Abstract

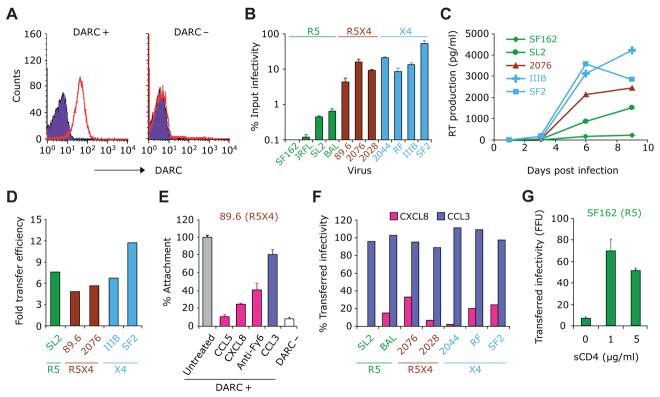
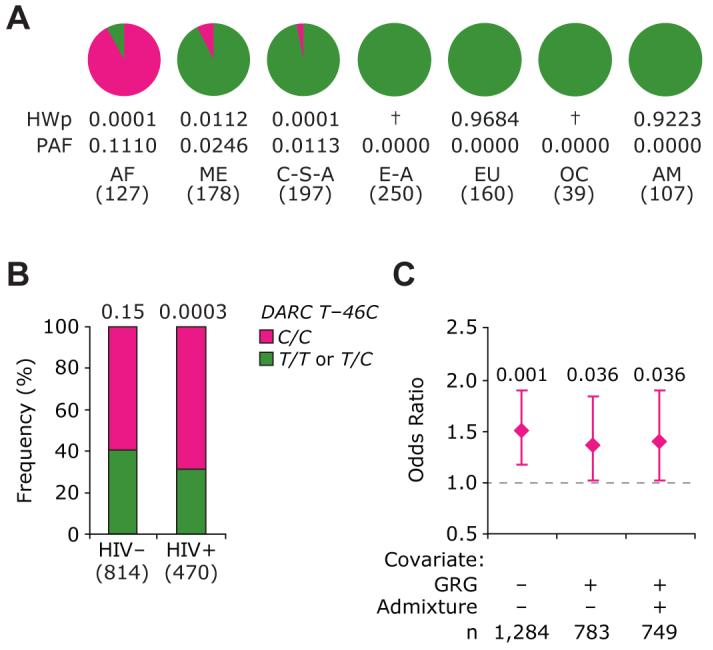
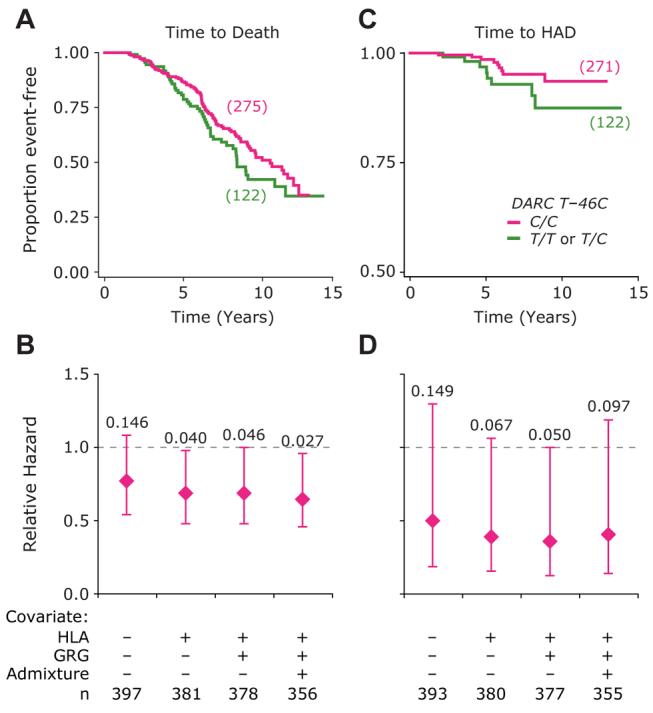
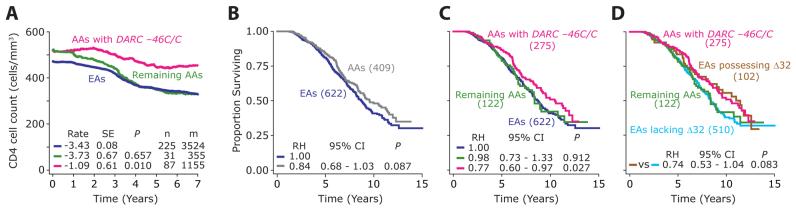
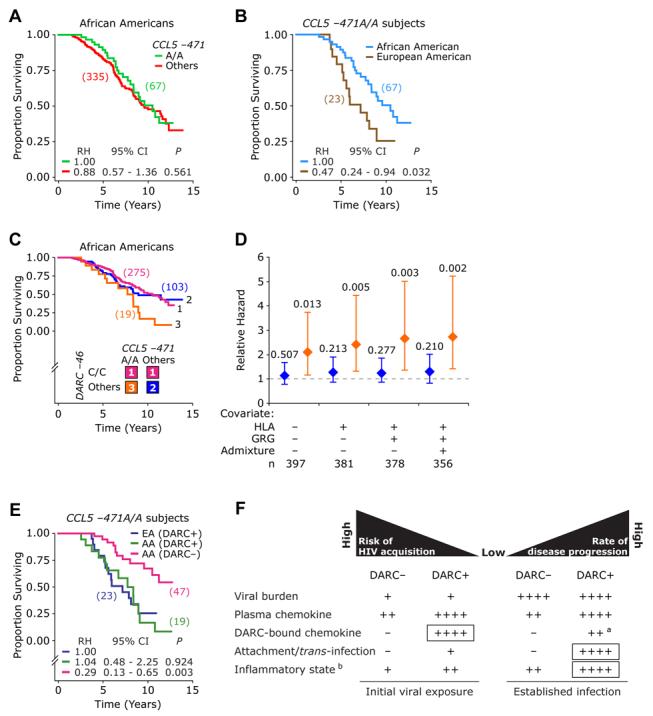
Duffy antigen receptor for chemokines (DARC) expressed on red blood cells (RBCs) influences plasma levels of HIV-1-suppressive and proinflammatory chemokines such as CCL5/RANTES. DARC is also the RBC receptor for Plasmodium vivax. Africans with DARC -46C/C genotype, which confers a DARC-negative phenotype, are resistant to vivax malaria. Here, we show that HIV-1 attaches to RBCs via DARC, effecting trans-infection of target cells. In African Americans, DARC -46C/C is associated with 40% increase in the odds of acquiring HIV-1. If extrapolated to Africans, approximately 11% of the HIV-1 burden in Africa may be linked to this genotype. After infection occurs, however, DARC-negative RBC status is associated with slower disease progression. Furthermore, the disease-accelerating effect of a previously described CCL5 polymorphism is evident only in DARC-expressing and not in DARC-negative HIV-infected individuals. Thus, DARC influences HIV/AIDS susceptibility by mediating trans-infection of HIV-1 and by affecting both chemokine-HIV interactions and chemokine-driven inflammation.


Figures

Figure 1
Figure 1. DARC Binds and Transfers HIV-1 to Target Cells
(A) Representative flow-cytometric analysis of RBCs for immunostaining of DARC. RBCs were stained with the DARC monoclonal antibody anti-Fy6 (red) or an isotype control (violet). (B) Purified human DARC+ RBCs as shown in (A) were incubated with equal amounts of HIV-1 strains with varying coreceptor usages, washed, and added to target NP2 cells bearing CD4 and the appropriate coreceptor (CCR5 or CXCR4). Viral transfer was quantified as the percentage of the input titer recovered from RBCs. (C) Time course of RT production in human PBMCs cocultured with HIV-loaded RBCs. Using methods similar to those described for (B), HIV-loaded RBCs were cocultured with fresh-activated human PBMCs, and infection was followed by RT output over 9 days. (D) Relative efficiency of transfer of HIV to donor cells by DARC+ versus DARC− RBCs. RBCs from known DARC+ and DARC− donors as shown in (A) were incubated with PBMCs as in (C), and supernatant RT activity was measured 5 days postinfection. The bars represent the ratio of transfer efficiency of DARC+ RBCs divided by that of DARC− RBCs. (E) Attachment of the R5X4 strain 89.6 to RBCs was inhibited by rhCCL5 (RANTES; 1 nM), rhCXCL8 (IL-8; 1 nM), and the anti-DARC monoclonal Fy6 (anti-Fy6), but not by rhCCL3 (MIP-1αS; 1 nM). Data are presented as percentage of cell-associated RT activity compared to the untreated RBCs (gray). (F) rhCXCL8, but not rhCCL3, inhibited transfer of infectious HIV-1 strains to fresh human PBMCs, shown as percent RT output compared to untreated RBCs 5 days postinfection. (G) Transfer efficiency of SF162 by RBCs to target NP2.CD4.R5 was increased by the addition of 1 and 5 μg/ml of sCD4 compared to media alone (0). Data in (B), (E), and (G) are mean ± SEM, as indicated by error bars, while data in (C), (D), and (F) are from one representative experiment from over three separate experiments conducted.
Figure 2
Figure 2. Distribution of the DARC46C/C in Worldwide Populations and Its Association with Risk of Acquiring HIV Infection in the African-American Component of the HIV+ WHMC Cohort
(A) Distribution of and PAF for the DARC46C/C genotype in different populations represented in the HGDP-CEPH DNA samples. Pie charts show the distribution of the −46C/C genotype in seven populations: AF (Africa), ME (Middle East), C-S-A (Central South Asia), E-A (East Asia), EU (Europe), OC (Pacific Ocean), and AM (America). HWp: Hardy-Weinberg test P value. †, minor allele was absent and HWp not applicable. (B) Distribution of the color-coded DARC46C/C genotype in the WHMC HIV-negative (HIV−) and HIV-positive (HIV+) African Americans from the WHMC cohort. The numbers at the top of each bar represent HWp. (C) Risk of acquiring HIV based on the T46C genotype in African-American subjects (n = 1284) from the WHMC cohort. The diamonds and error bars show the odds ratio and 95% confidence intervals for risk of acquiring HIV in subjects possessing the DARC46C/C genotype (DARC− on RBCs) relative to the subjects possessing the DARC46T/C or T/T genotype (DARC+ on RBCs). Numbers at the top of the error bars are significance values. The results are from multivariate logistic regression analyses. Three models were assessed: first with no covariates, then we added the CCL3L1-CCR5 GRGs as a covariate, and finally we added the degree of population admixture as another covariate. Number of subjects in each genotypic group is shown in parentheses for (A) and (B) and at the bottom of (C), respectively.
Figure 3
Figure 3. Influence of the DARC T46C Polymorphism on HIV Disease Progression in the African-American Component of HIV + WHMC Cohort
(A) Kaplan-Meier plots for time to death based on possession of −46C/C genotype (pink) or possession of −46T/C or −46T/T genotype (green). (B) Results of multivariate Cox proportional hazards models for rate of disease progression in subjects possessing the DARC46C/C genotype (pink) relative to the subjects possessing the DARC46T/C or T/T genotype (green; relative hazard [RH] = 1). The following three covariates were sequentially included in the model: (1) HLA refers to possession of the following three HLA alleles (HLA-A*68, HLA-B*57, and HLAC*16); (2) CCL3L1-CCR5 GRGs; and (3) degree of population admixture. The diamonds and error bars represent the RHs and 95% confidence intervals (CI) for progression to death. Numbers at the top are significance values. These three HLA alleles associate with a rapid rate of disease progression in the WHMC cohort (Ahuja et al., 2008). (C) Kaplan-Meier plots for time to HIV-associated dementia (HAD) based on possession of the −46C/C genotype (pink) or possession of −46T/C or −46T/T genotype (green). (D) The results of multivariate Cox proportional hazards modeling similar to those shown in (B) but for the outcome of HAD. Number of subjects in each genotypic group is shown in parentheses for (A) and (C) and at the bottom of (B) and (D), respectively.
Figure 4
Figure 4. Contribution of DARC46C/C to Ethnicity-Specific Differences in Rates of Disease Progression in the HIV+ WHMC Cohort
(A) Time course of CD4+ T cell count decline in HIV+ subjects possessing the indicated DARC genotypes. The panel shows Loess curves for HIV+ African Americans with the indicated genotypic groups: −46C/C (pink), −46T/T, or T/C (green),and the overall group of HIV+ European Americans (blue). The average rate of decline in CD4+ T cell count (cells/month) was estimated using GEE, and it is shown at the bottom of the panel. SE stands for standard error and P for significance value for the difference between the rates of CD4+ T cell decline as assessed by Student's t test and using European Americans as the reference group. Data are from subjects who did not receive antiretroviral therapy. n, numbers of subjects; m, numbers of CD4+ T cell count measurements. (B–D) The Kaplan-Meier plots showing the differences in rate of progression to death (B) between European Americans (blue) and African Americans (gray) in the WHMC HIV+ cohort. (C) shows African Americans with (pink) and without (green) the DARC46C/C genotype and European Americans (blue); (D) shows African Americans with (pink) and without (green) the −46C/C genotype and European Americans with (brown) and without (blue) the CCR5Δ32 mutation. RH = 1.00 indicates the reference group used in statistical analysis. Numbers of subjects in each genotypic group in (B–D) are shown in parentheses. EAs, European Americans. AAs, African Americans.
Figure 5
Figure 5. Proof-of-Concept Genetic Epidemiologic Studies Illustrating DARC-Chemokine-HIV-1 Interplay
(A) The disease-influencing effect of CCL5471G > A SNP in HIV+ African Americans before accounting for DARC genotype. The analysis compares CCL5471A/A versus −471A/G or −471G/G (others). (B) Disease-influencing effects of CCL5471A/A genotype in European Americans and African Americans. (C and D) Disease-influencing effects in African Americans of the three color-coded DARC-CCL5 genotypic groups. (C) shows Kaplan-Meier plots for association with time to death. (D) shows the results of multivariate Cox proportional hazards models that examined the association of the three DARC-CCL5 genotypic groups shown in (C) with time to death. The Cox models used the subjects possessing the DARC46C/C genotype as the reference group. The covariates used in the models were HLA alleles (A*68, B*57, and C*16), CCL3L1-CCR5 GRGs, and the degree of population admixture. The diamonds and error bars represent the RH and 95% confidence intervals for progression to death was obtained using Cox proportional hazards models. Numbers at the top of the error bars are significance values. (E) Disease-influencing effects of CCL5471A/A genotype in European Americans (EAs) or African Americans (AAs) according to DARC-expression status on RBCs inferred by DARC genotypes (DARC expression on RBCs, i.e., DARC+ in those with −46T/T or −46T/C and DARC nonexpression on RBCs [DARC−] in those with DARC46C/C). The number of subjects in each genotypic group is shown in parentheses for (A), (B), (E), and at the bottom of (D), respectively. (F) A hypothetical model of DARC-influencing effects on susceptibility to risk of HIV acquisition (left) and disease progression (right) based on (1) results of the present study, (2) published literature regarding the impact of DARC on plasma and erythrocyte bound-chemokine levels, and (3) the known role of inflammation in HIV pathogenesis. The model is discussed in detail in the text. DARC+ and DARC_are as described in (E). aDARC-bound chemokine levels are anticipated to be lower during established HIV infection in DARC+ individuals than in DARC+ individuals at time of initial viral exposure. This is because during established HIV infection, HIV-1 will compete for DARC-bound chemokines. bChemokine-mediated inflammatory state is shown; boxes designate the dominant effects of DARC at time of initial exposure to virus and during established infection.

Comment in

References

    1. Abu-Raddad LJ, Patnaik P, Kublin JG. Dual infection with HIV and malaria fuels the spread of both diseases in sub-Saharan Africa. Science. 2006;314:1603–1606. - PubMed
    1. Ahuja SK, Kulkarni H, Catano G, Agan BK, Camargo JF, He W, O'Connell RJ, Marconi VC, Delmar J, Eron J, et al. CCL3L1-CCR5 genotype influences durability of immune recovery during antiretroviral therapy of HIV-1-infected individuals. Nat Med. 2008;14:413–420. - PMC - PubMed
    1. Banki Z, Wilflingseder D, Ammann CG, Pruenster M, Mullauer B, Hollander K, Meyer M, Sprinzl GM, van Lunzen J, Stellbrink HJ, et al. Factor I-mediated processing of complement fragments on HIV immune complexes targets HIV to CR2-expressing B cells and facilitates B cell-mediated transmission of opsonized HIV to T cells. J Immunol. 2006;177:3469–3476. - PubMed
    1. Buve A. HIV epidemics in Africa: what explains the variations in HIV prevalence? IUBMB Life. 2002;53:193–195. - PubMed
    1. Comerford I, Nibbs RJ. Post-translational control of chemokines: a role for decoy receptors? Immunol Lett. 2005;96:163–174. - PubMed

Publication types

MeSH terms