. 2008 Aug 26;155(3):923-36.
doi: 10.1016/j.neuroscience.2008.06.031. Epub 2008 Jun 19.

Timing of sound-evoked potentials and spike responses in the inferior colliculus of awake bats

Affiliations

Timing of sound-evoked potentials and spike responses in the inferior colliculus of awake bats

S V Voytenko et al. Neuroscience. .

Abstract

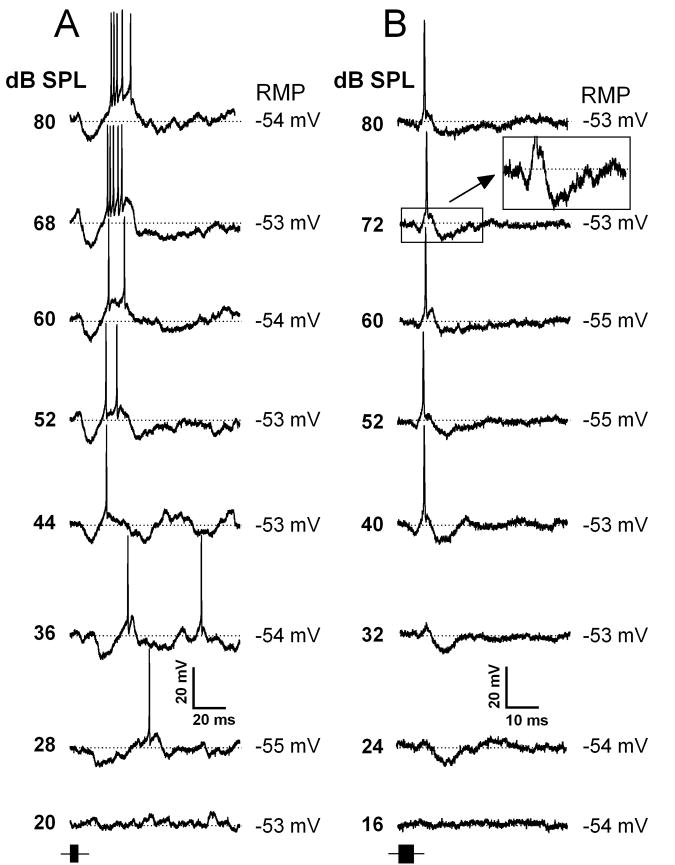
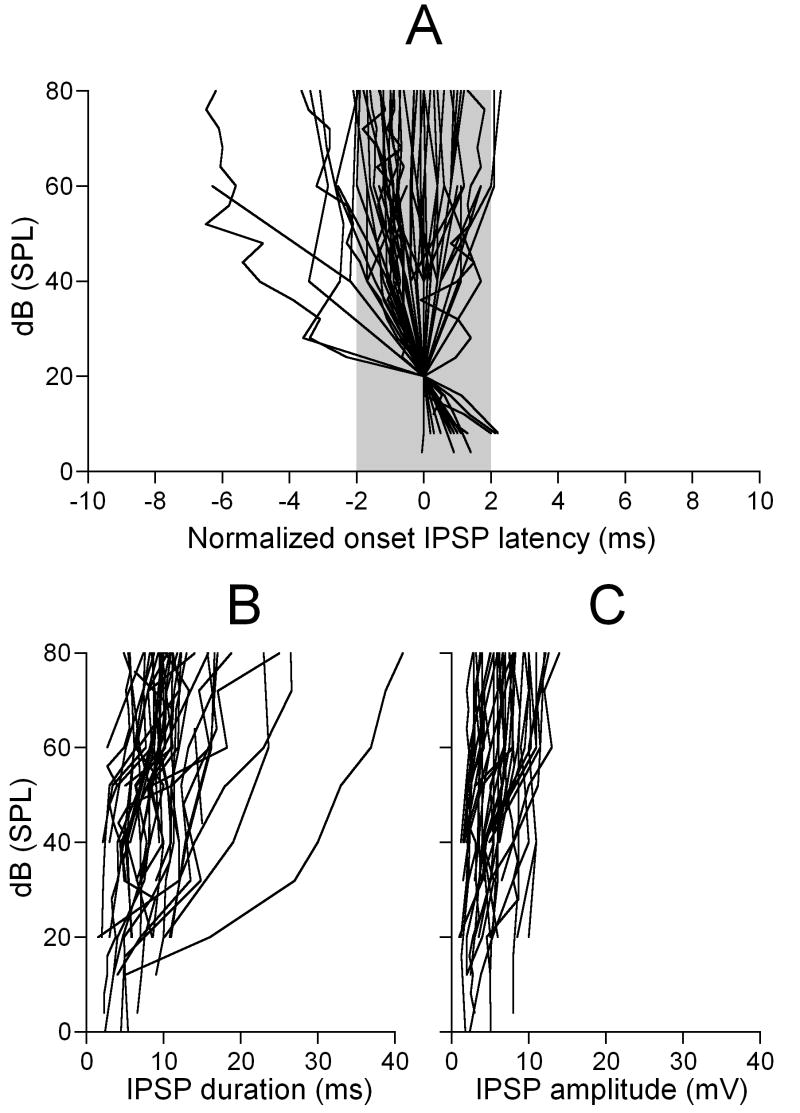
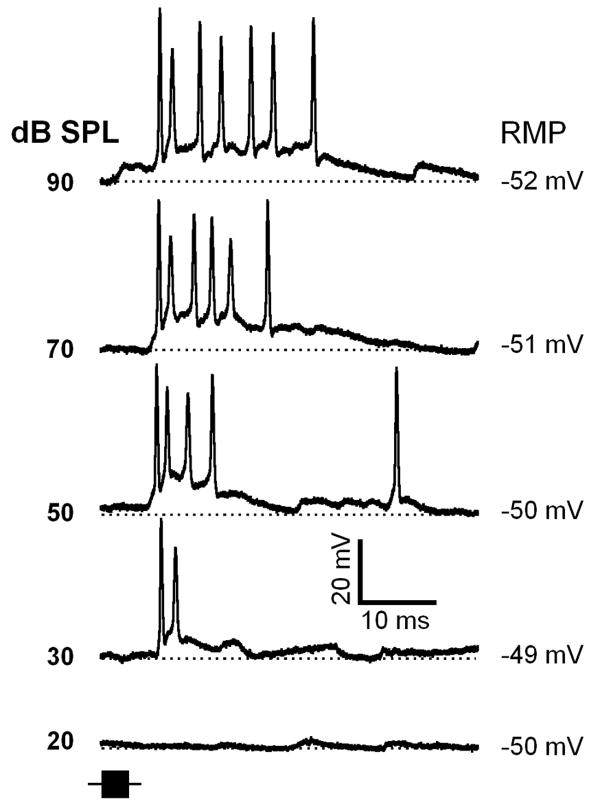
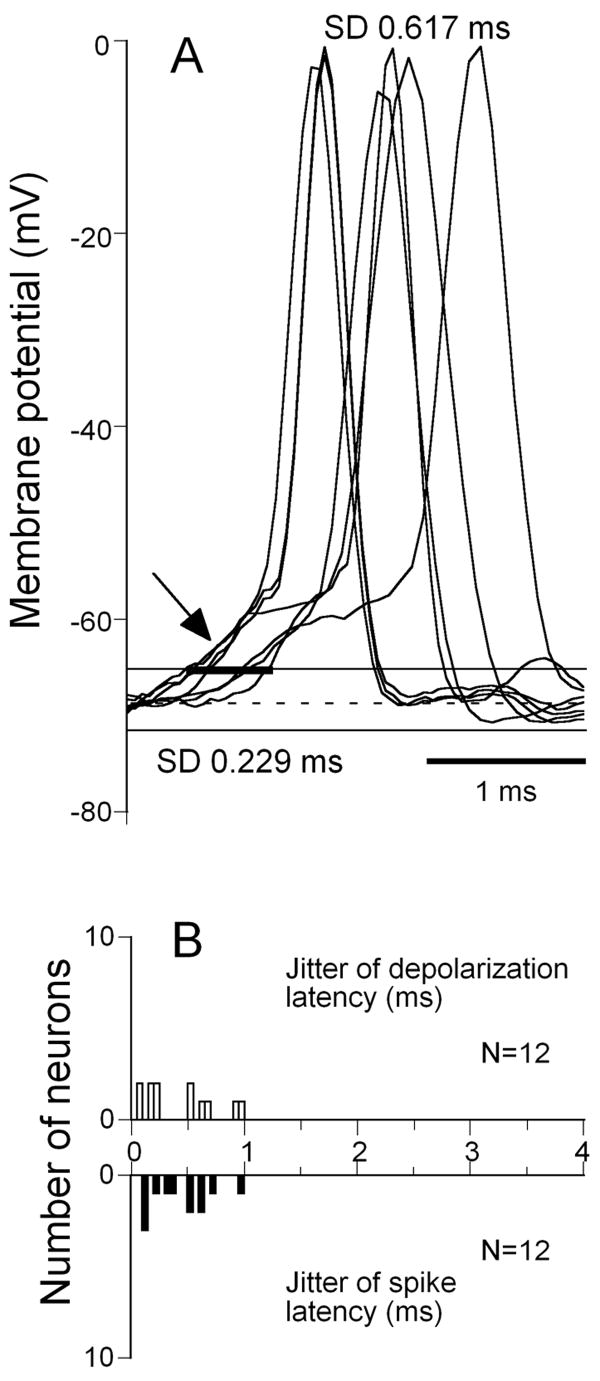
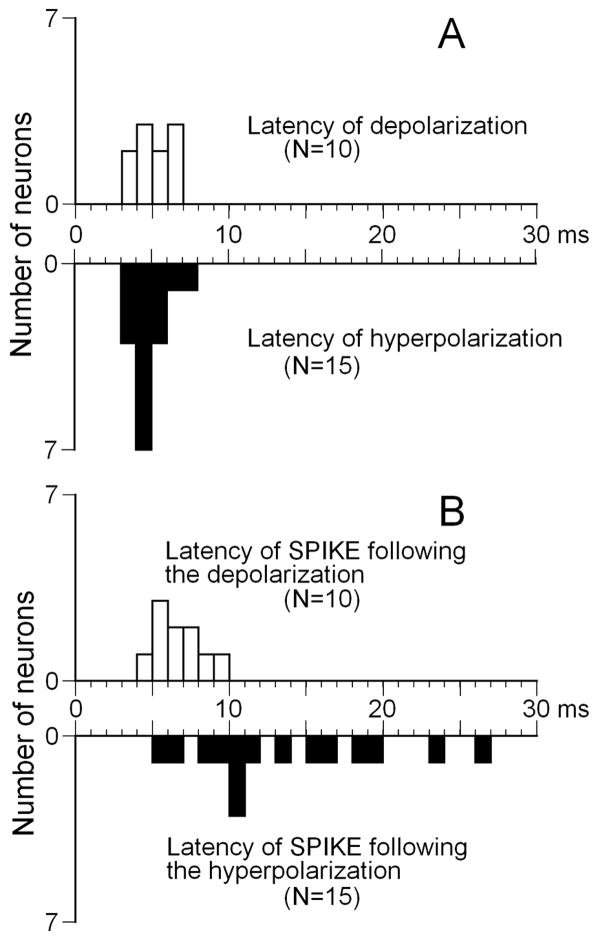
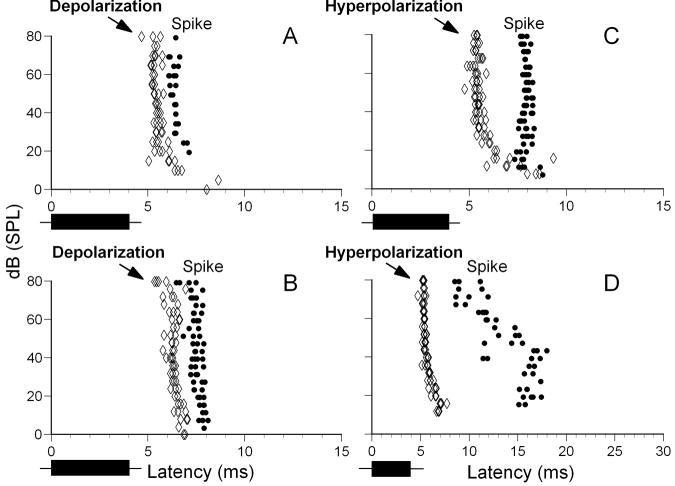
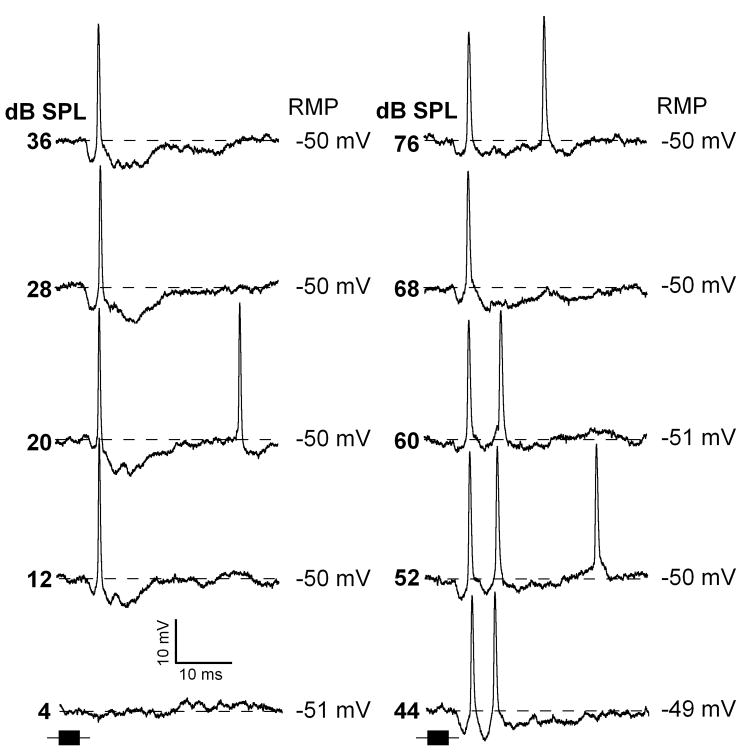
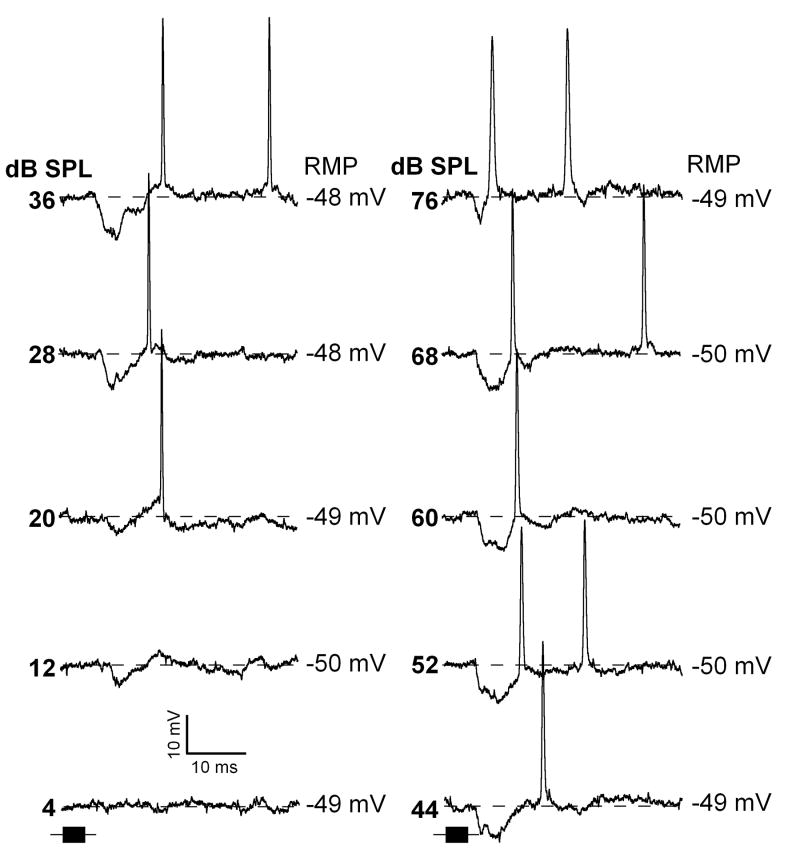
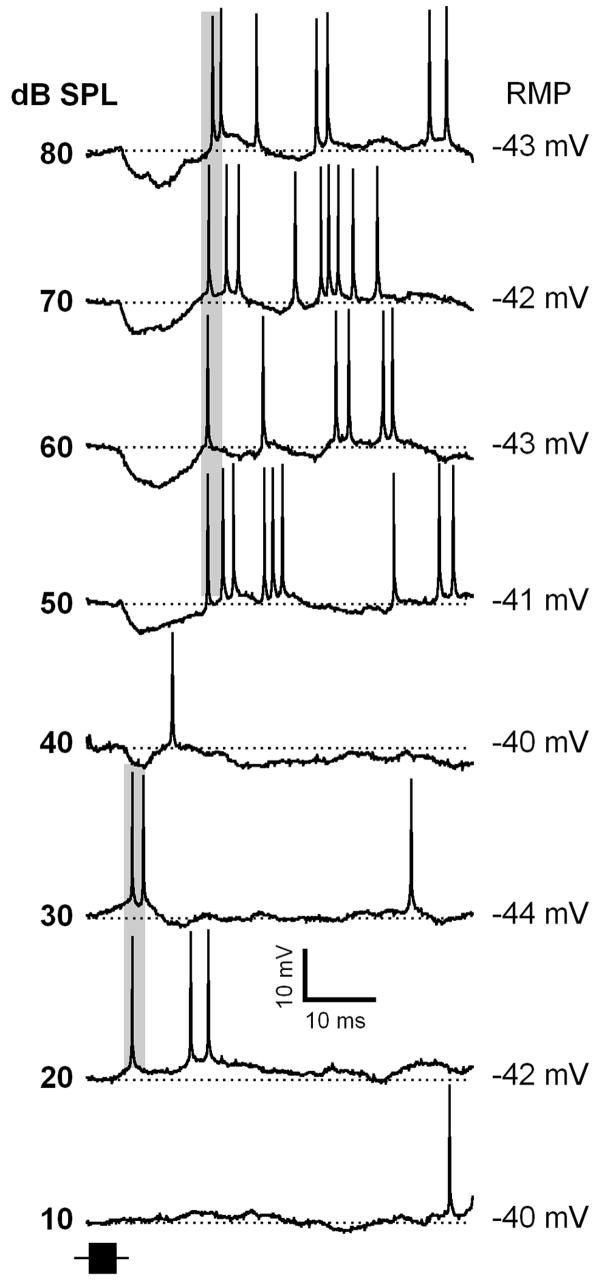
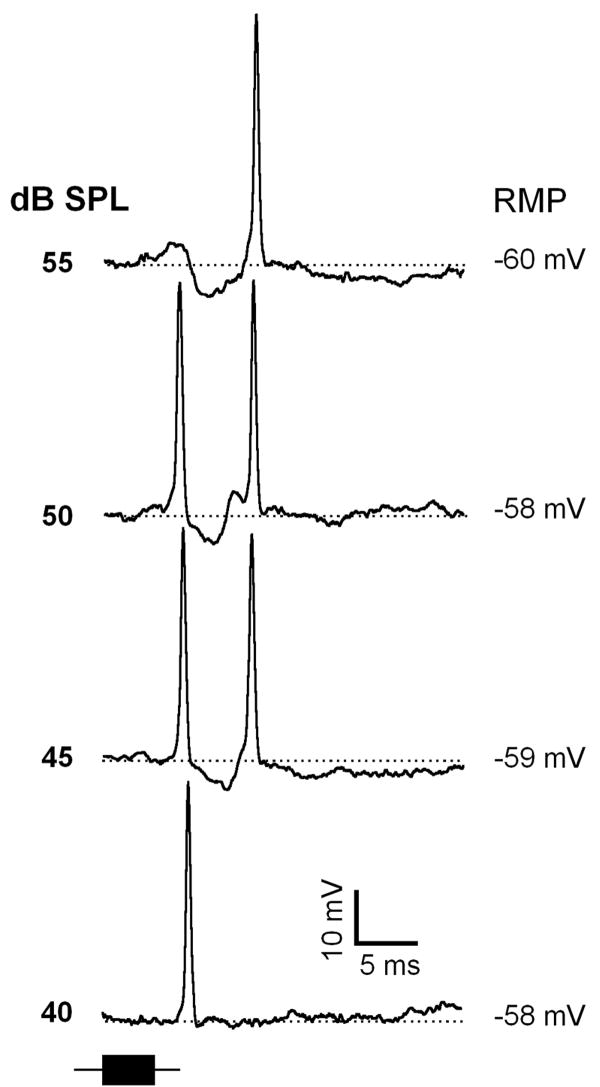
Neurons in the inferior colliculus (IC), one of the major integrative centers of the auditory system, process acoustic information converging from almost all nuclei of the auditory brain stem. During this integration, excitatory and inhibitory inputs arrive to auditory neurons at different time delays. Result of this integration determines timing of IC neuron firing. In the mammalian IC, the range of the first spike latencies is very large (5-50 ms). At present, a contribution of excitatory and inhibitory inputs in controlling neurons' firing in the IC is still under debate. In the present study we assess the role of excitation and inhibition in determining first spike response latency in the IC. Postsynaptic responses were recorded to pure tones presented at neuron's characteristic frequency or to downward frequency modulated sweeps in awake bats. There are three main results emerging from the present study: (1) the most common response pattern in the IC is hyperpolarization followed by depolarization followed by hyperpolarization, (2) latencies of depolarizing or hyperpolarizing responses to tonal stimuli are short (3-7 ms) whereas the first spike latencies may vary to a great extent (4-26 ms) from one neuron to another, and (3) high threshold hyperpolarization preceded long latency spikes in IC neurons exhibiting paradoxical latency shift. Our data also show that the onset hyperpolarizing potentials in the IC have very small jitter (<100 micros) across repeated stimulus presentations. The results of this study suggest that inhibition, arriving earlier than excitation, may play a role as a mechanism for delaying the first spike latency in IC neurons.


Figures

Figure 1
Figure 1
Representative intracellular recordings from two IC neurons with the most common response pattern (hyperpolarization-depolarization(spike)-hyperpolarization) elicited by a 80 kHz to 20 kHz FM sweep. A, Intracellular responses of an IC neuron exhibiting a depolarization in between hyperpolarizations to FM sweeps presented at different sound levels as indicated. B, Intracellular responses of an IC neuron with a similar response pattern to the neuron shown in A, but exhibiting a depolarization close to the onset of the hyperpolarization. Inset shows an expanded part of 72 dB trace (indicated by a rectangular). The time course of the FM sweep stimulus is shown by a black horizontal bar at the lower left of each column (same time scale as intracellular traces). Time and amplitude scales are shown at the bottom of each column. Horizontal dotted lines indicate the resting membrane potential (shown on the right of each trace). The cells shown in A and B were recorded at depth of 390 μm and 1100 μm, respectively.
Figure 2
Figure 2
Sound level-dependent changes in response latency, duration, and amplitude of onset hyperpolarization in responses of 52 IC neurons. A, latency-level functions normalized to the values measured at 20 dB SPL (0 value on the X axis). A shaded area shows a population of neurons exhibiting changes less than ±1 ms. B, Level-dependent changes in amplitude of the response hyperpolarization. C, Level-dependent changes in duration of the response hyperpolarization.
Figure 3
Figure 3
Depolarization-spike response patterns from a neuron representative of a small population of IC neurons. This less typical response pattern shows the absence of hyperpolarizations in response to an FM sweep across a range of sound levels. The time course of the FM sweep stimulus is represented by a black horizontal bar at the lower left. Time and amplitude scale is shown at the bottom. Depth of recording = 720 μm. For protocols, see Fig.1.
Figure 4
Figure 4
Response latency jitter of IC neurons showing the typical hyperpolarization-depolarization(spike)-hyperpolarization response pattern. A, Superposition of intracellular response traces from a representative IC neuron to the same FM sweep presented 4 times. B, magnified view of 4 superimposed hyperpolarizations. Measurements of hyperpolarization jitter were made at a point where an hyperpolarization crosses the lines defining the 95% confidence limits, shown by solid horizontal lines (see method section for further details). C, magnified view of 4 superimposed spikes. Spike jitter was determined by using the first spike latency measured at the peak of each spike. D,E distribution of latency jitter for 62 IC neurons measured for their onset hyperpolarizations (D) and the first spike latencies (E). Bin size equals 1 ms. Vrest = - 48 mV, depth of recording = 1090 μm.
Figure 5
Figure 5
Response latency jitter of IC neurons showing onset depolarization(spike) response pattern. Recordings from a neuron with a depolarization(spike) response pattern showing similar jitter in latency of the initial depolarization and the first spike latency. A, Superposition of intracellular response traces of a representative IC neuron to the same FM sweep presented 6 times. B, distribution of latency jitter for 12 IC neurons measured for their onset depolarizations (B) and the first spike latencies (C). Vrest = - 69 mV, depth of recording = 870 μm.
Figure 6
Figure 6
Distribution of response latencies for 25 IC neurons in response to pure tones (onset at 0 ms) at each neuron’s CF. Latency refers to sound evoked potentials (shown in A) and the first spike latency (shown in B). Bin size equals 1 ms.
Figure 7
Figure 7
Distribution of response latencies for 4 IC neurons (A - D) in response to pure tones at neuron’s CF presented at different sound levels. Latency refers to sound evoked depolarizing potentials (A, B) or hyperpolarizing potentials (C, D) (both shown by open diamonds) and the first spike latency (shown by black dots). For protocols, see Fig.1.
Figure 8
Figure 8
Representative response traces of an IC neuron exhibiting sound evoked onset hyperpolarization with an action potential response at rising phase of the hyperpolarization (same neuron as in Fig.7C). Time course of the pure tones (52 kHz) are shown by black horizontal bars at the bottom of each column. Depth of recording = 1300 μm. For protocols, see Fig.1.
Figure 9
Figure 9
Representative response traces of an IC neuron exhibiting sound evoked onset hyperpolarization with action potential response at end of the hyperpolarization (same neuron as in Fig.7D). Time course of the pure tones (32 kHz) are shown by black horizontal bars at the bottom of each column (same time scale as intracellular traces). Depth of recording = 1090 μm. For protocols, see Fig.1.
Figure 10
Figure 10
Representative response traces of an IC neuron exhibiting a paradoxical latency shift (PLS). The transition in the PLS occurs at 40 dB SPL. Shaded areas indicate spike responses determined based on multiple presentations of the same stimulus. Depth of recording = 472 μm. For protocols, see Fig.1.
Figure 11
Figure 11
Representative response traces of a paradoxical latency shift IC neuron exhibiting spike responses at short and long latencies at the transition (45 - 50 dB SPL). Depth of recording = 715 μm. For protocols, see Fig.1.

References

    1. Aitkin LM, Anderson DJ, Brugge JF. Tonotopic organization and discharge characteristics of single neurons in nuclei of the lateral lemniscus of the cat. J Neurophysiol. 1970;33:421–440. - PubMed
    1. Azouz R, Gray CM. Dynamic spike threshold reveals a mechanism for synaptic coincidence detection in cortical neurons in vivo. Proc Natl Acad Sci USA. 2000;97:8110–8115. - PMC - PubMed
    1. Berkowitz A, Suga N. Neural mechanisms of ranging are different in two species of bats. Hear Res. 1989;41:255–264. - PubMed
    1. Binns KE. The synaptic pharmacology underlying sensory processing in the superior colliculus. Prog Neurobiol. 1999;59:129–159. - PubMed
    1. Blitz DM, Regehr WG. Retinogeniculate synaptic properties controlling spike number and timing in relay neuron. J Neurophysiol. 2003;90:2438–2450. - PubMed

Publication types