

A tractography comparison between turboprop and spin-echo echo-planar diffusion tensor imaging
- PMID: 18621131
- PMCID: PMC2610410
- DOI: 10.1016/j.neuroimage.2008.05.066
A tractography comparison between turboprop and spin-echo echo-planar diffusion tensor imaging
Abstract
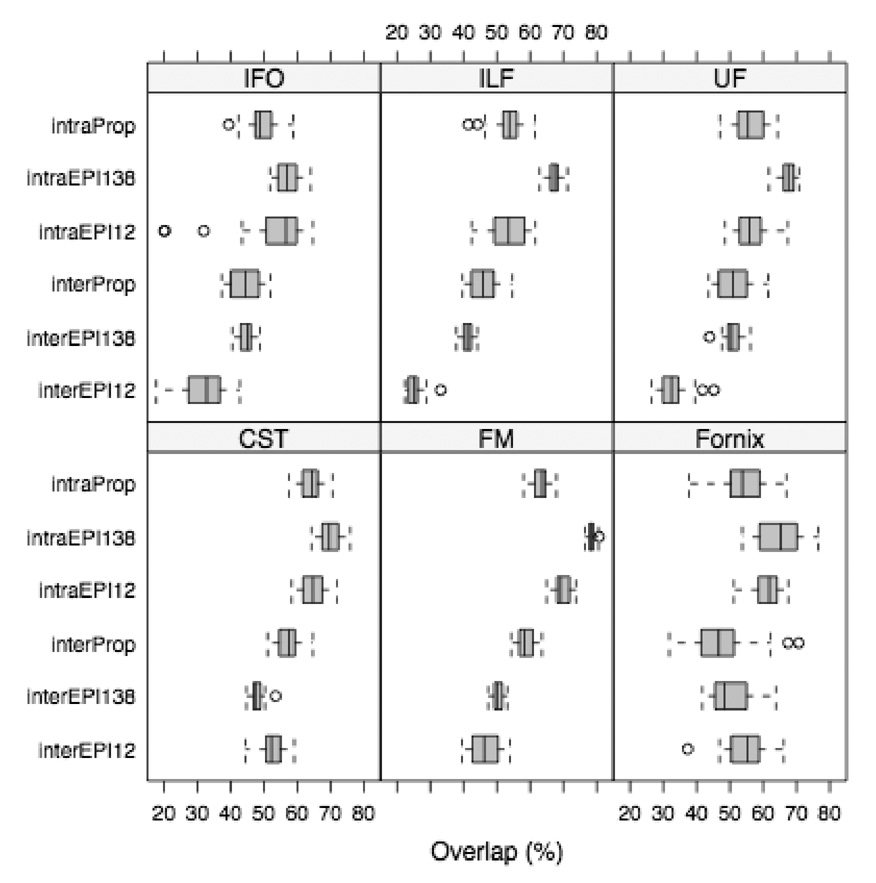
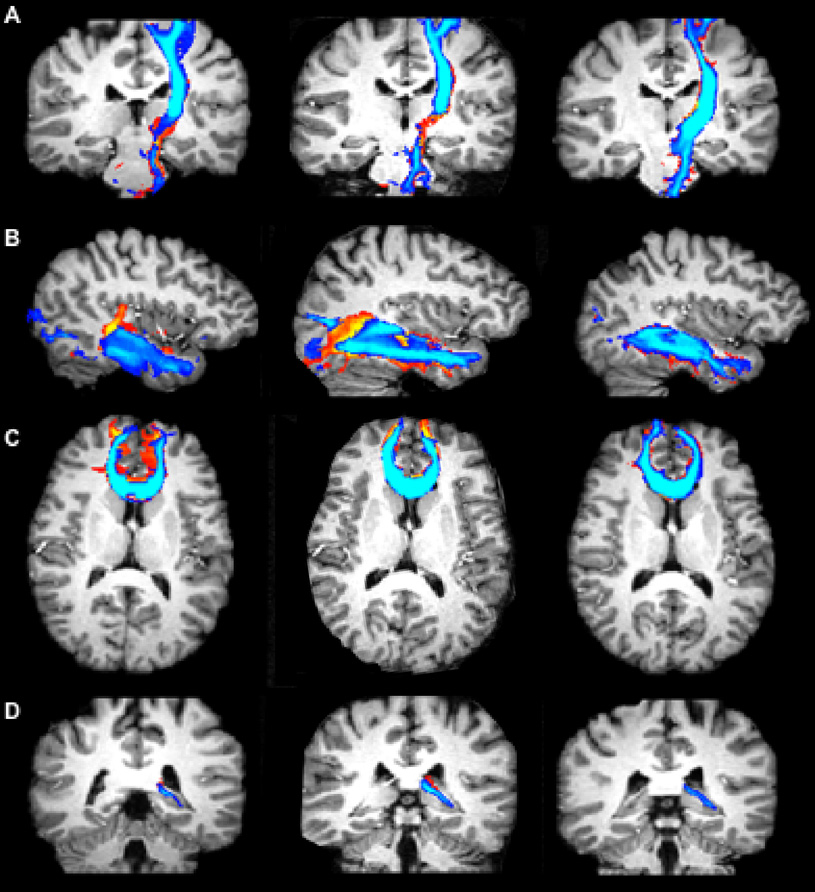
The development of accurate, non-invasive methods for mapping white matter fiber-tracts is of critical importance. However, fiber-tracking is typically performed on diffusion tensor imaging (DTI) data obtained with echo-planar-based imaging techniques (EPI), which suffer from susceptibility-related image artifacts, and image warping due to eddy-currents. Thus, a number of white matter fiber-bundles mapped using EPI-based DTI data are distorted and/or terminated early. This severely limits the clinical potential of fiber-tracking. In contrast, Turboprop-MRI provides images with significantly fewer susceptibility and eddy-current-related artifacts than EPI. The purpose of this work was to compare fiber-tracking results obtained from DTI data acquired with Turboprop-DTI and EPI-based DTI. It was shown that, in brain regions near magnetic field inhomogeneities, white matter fiber-bundles obtained with EPI-based DTI were distorted and/or partially detected, when magnetic susceptibility-induced distortions were not corrected. After correction, residual distortions were still present and several fiber-tracts remained partially detected. In contrast, when using Turboprop-DTI data, all traced fiber-tracts were in agreement with known anatomy. The inter-session reproducibility of tractography results was higher for Turboprop than EPI-based DTI data in regions near field inhomogeneities. Thus, Turboprop may be a more appropriate DTI data acquisition technique for tracing white matter fibers near regions with significant magnetic susceptibility differences, as well as in longitudinal studies of such fibers. However, the intra-session reproducibility of tractography results was higher for EPI-based than Turboprop DTI data. Thus, EPI-based DTI may be more advantageous for tracing fibers minimally affected by field inhomogeneities.
Figures
Similar articles
-
White matter tractography by means of Turboprop diffusion tensor imaging.Ann N Y Acad Sci. 2005 Dec;1064:78-87. doi: 10.1196/annals.1340.014. Ann N Y Acad Sci. 2005. PMID: 16394149
-
Optimization of white matter tractography for pre-surgical planning and image-guided surgery.Oncol Rep. 2006;15(4):1061-1064. doi: 10.3892/or.15.4.1061. Oncol Rep. 2006. PMID: 16525701
-
Mean diffusivity, fractional anisotropy maps, and three-dimensional white-matter tractography by diffusion tensor imaging. Comparison between single-shot fast spin-echo and single-shot echo-planar sequences at 1.5 Tesla.Eur Radiol. 2008 Apr;18(4):830-4. doi: 10.1007/s00330-007-0805-9. Epub 2007 Nov 13. Eur Radiol. 2008. PMID: 17999065
-
An image-processing toolset for diffusion tensor tractography.Magn Reson Imaging. 2007 Apr;25(3):365-76. doi: 10.1016/j.mri.2006.10.006. Epub 2006 Nov 20. Magn Reson Imaging. 2007. PMID: 17371726 Free PMC article. Review.
-
Diffusion tensor MR imaging and fiber tractography: technical considerations.AJNR Am J Neuroradiol. 2008 May;29(5):843-52. doi: 10.3174/ajnr.A1052. Epub 2008 Mar 13. AJNR Am J Neuroradiol. 2008. PMID: 18339719 Free PMC article. Review.
Cited by
-
Evaluation of standardized and study-specific diffusion tensor imaging templates of the adult human brain: Template characteristics, spatial normalization accuracy, and detection of small inter-group FA differences.Neuroimage. 2018 May 15;172:40-50. doi: 10.1016/j.neuroimage.2018.01.046. Epub 2018 Jan 28. Neuroimage. 2018. PMID: 29414497 Free PMC article.
-
Development of a human brain diffusion tensor template.Neuroimage. 2009 Jul 15;46(4):967-80. doi: 10.1016/j.neuroimage.2009.03.046. Epub 2009 Mar 31. Neuroimage. 2009. PMID: 19341801 Free PMC article.
-
Role of standardized and study-specific human brain diffusion tensor templates in inter-subject spatial normalization.J Magn Reson Imaging. 2013 Feb;37(2):372-81. doi: 10.1002/jmri.23842. Epub 2012 Oct 3. J Magn Reson Imaging. 2013. PMID: 23034880 Free PMC article.
-
Distribution and fibre field similarity mapping of the human anterior commissure fibres by diffusion tensor imaging.MAGMA. 2010 Dec;23(5-6):399-408. doi: 10.1007/s10334-010-0201-3. Epub 2010 Mar 13. MAGMA. 2010. PMID: 20229087
-
Independent component analysis of DTI reveals multivariate microstructural correlations of white matter in the human brain.Hum Brain Mapp. 2012 Jun;33(6):1431-51. doi: 10.1002/hbm.21292. Epub 2011 May 12. Hum Brain Mapp. 2012. PMID: 21567660 Free PMC article.
References
-
- Alexander AL, Tsuruda JS, Parker DL. Elimination of eddy current artifacts in diffusion-weighted echo planar images: the use of bipolar gradients. Magn Reson Med. 1997;38:1016–1021. - PubMed
-
- Andersson JL, Skare S, Ashburner J. How to correct susceptibility distortions in spin-echo echo-planar images: application to diffusion tensor imaging. Neuroimage. 2003;20:870–888. - PubMed
-
- Bammer R, Auer M, Keeling SL, Augustin M, Stables LA, Prokesch RW, Stollberger R, Moseley ME, Fazekas F. Diffusion tensor imaging using single-shot SENSE-EPI. Magn Reson Med. 2002;48:128–136. - PubMed
-
- Basser PJ, Mattiello J, Le Bihan D. Estimation of the effective self-diffusion tensor from the NMR spin echo. J Magn Reson B. 1994;103:247–254. - PubMed
-
- Basser PJ. Inferring microstructural features and the physiological state of tissues from diffusion-weighted images. NMR in Biomedicine. 1995;8:333–344. - PubMed
Publication types
MeSH terms
Grants and funding
LinkOut - more resources
Full Text Sources
