. 2008 Jul 11;321(5886):218-23.
doi: 10.1126/science.1157657.

Identifying autism loci and genes by tracing recent shared ancestry

Affiliations

Identifying autism loci and genes by tracing recent shared ancestry

Eric M Morrow et al. Science. .

Erratum in

  • Science. 2010 Dec 24;330(6012):1746

Abstract

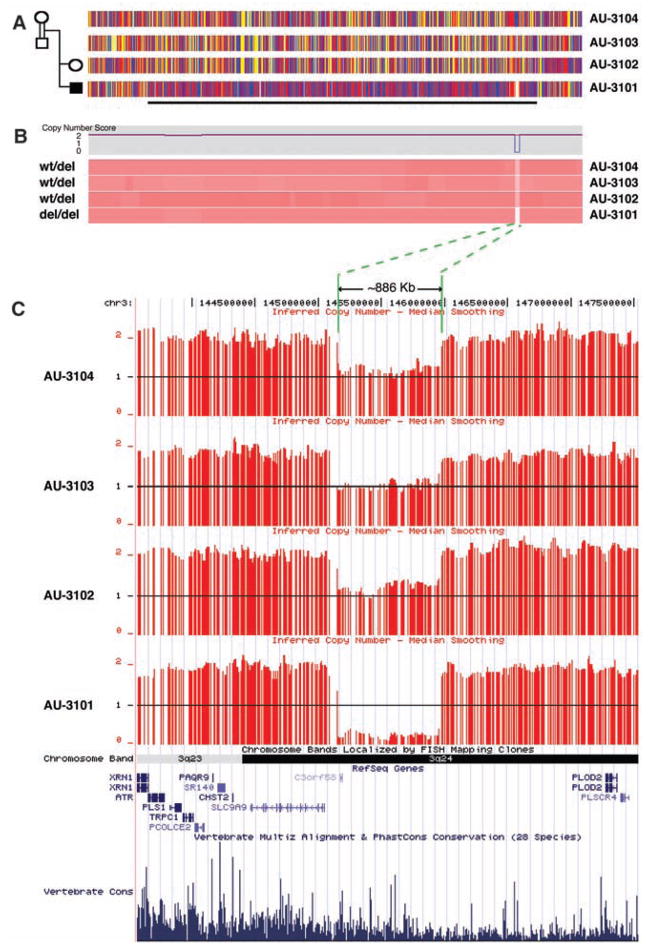
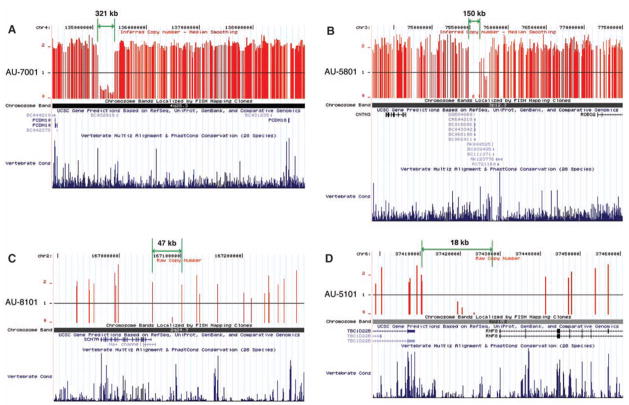
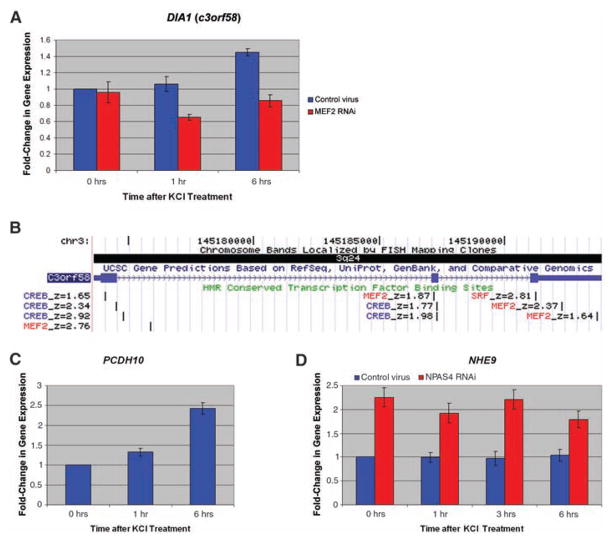
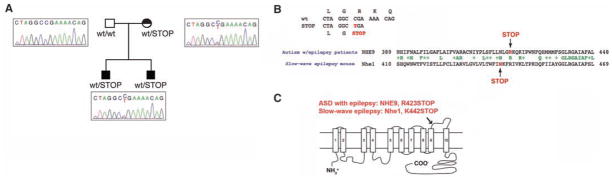
To find inherited causes of autism-spectrum disorders, we studied families in which parents share ancestors, enhancing the role of inherited factors. We mapped several loci, some containing large, inherited, homozygous deletions that are likely mutations. The largest deletions implicated genes, including PCDH10 (protocadherin 10) and DIA1 (deleted in autism1, or c3orf58), whose level of expression changes in response to neuronal activity, a marker of genes involved in synaptic changes that underlie learning. A subset of genes, including NHE9 (Na+/H+ exchanger 9), showed additional potential mutations in patients with unrelated parents. Our findings highlight the utility of "homozygosity mapping" in heterogeneous disorders like autism but also suggest that defective regulation of gene expression after neural activity may be a mechanism common to seemingly diverse autism mutations.


Figures

Fig. 1
Fig. 1
Homozygosity mapping in pedigree AU-3100 reveals an ~886-kb inherited homozygous deletion at 3q24 within a 74 cM block of IBD in patient AU-3101, who has autism with seizures. (A) SNP genotypes for each subject in the pedigree using the 500K SNP microarray along chromosome 3q. The four horizontal tracks represent SNP genotyping data along 3q from centromere to telomere moving left to right, aligned with each individual in the pedigree. Red and blue vertical hatches represent homozygous SNPs, and yellow hatches indicate heterozygosity. The horizontal black line demarcates the 74-cM region of IBD in patient 3101 that is not found in an unaffected sibling or parents. (B) Copy number data using the 500K SNP microarray and dCHIP (45) hidden Markov model inferred methodology aligned with the genotyping SNPs from (A). The top panel indicates copy number (CN) score for AU-3101, and the lower panel shows pink tracks corresponding to CN data for all corresponding SNPs along 3q24 above. Dark pink shade indicates CN = 2 for the majority of this region. A white area in AU-3101 represents the homozygous deletion. The light pink equivalent region in AU-3102, AU-3103, and AU-3104 represents CN = 1 or carrier status of the wild-type deletion (wt/del). (C) Mapping of inferred CN data SNP-by-SNP on the University of California Santa Cruz (UCSC) genome browser demonstrates the deletion of c3orf58 and an extensive genomic (likely regulatory) region 5′ to the transcriptional start of SLC9A9 (NHE9). Horizontal red lines indicate each SNP with copy number of 0, 1, or 2. Green lines and arrows demarcate the extent of the deletion. Alignment of annotated genes in the National Center for Biotechnology Information RefSeq database are shown, as well as a representation of vertebrate conservation using multiz and related tools in the UCSC/Penn State Bioinformatics comparative genomic alignment pipeline.
Fig. 2
Fig. 2
Homozygous deletions within regions of IBD that segregate with disease were identified using the Affymetrix 500K microarray and are represented as schematic diagrams using the UCSC genome browser. Vertical red lines indicate each SNP with copy number of 0, 1, or 2. The green lines and arrows indicate the distance between the two SNPs with copy number equal to or greater than 1 flanking each deletion. Chromosomal bands containing deletions, genes in the vicinity of deletions, and vertebrate conservation using multiz and related tools in the UCSC/Penn State Bioinformatics comparative genomic alignment pipeline are also shown. A second large deletion: (A) Homozygous deletion in AU-7001 within a protocadherin cluster proximal to PCDH10. Smaller deletions: (B) Homozygous deletion in AU-5801 encompasses 5′ noncoding region of CNTN3. (C) Homozygous deletion in AU-8101 contains 5′ noncoding regions of SCN7A and a related sodium channel isoform. (D) Homozygous deletion in AU-5101 removes 5′ region of RNF8 and 3′ noncoding region of TBC1D228, an un-characterized Rab guanosine triphosphatase. This deletion was fine-mapped using PCR to demonstrate that the deletion excludes the first exon of RNF8. (See also table S5.)
Fig. 3
Fig. 3
Genes within or juxtaposed to homozygous deletions show activity-dependent gene regulation or are targets of transcription factors regulated by neuronal activity. (A) Activation of DIA1 (c3orf58) gene expression in rat hippocampal cultures (0, 1, and 6 hours) after membrane depolarization with KCl. Control lentivirus shown in blue, and cultures transduced with MEF2A and MEF2D RNAi lentivirus shown in red. (B) The genomic structure of DIA1 (c3orf58), also showing highly conserved transcription factor binding sites based on meeting computation thresholds of conservation in human/mouse/rat alignment with the Transfac Matrix Database (v7.0) (www.gene-regulation.com). Prominent activity-regulated transcription factor sites, namely MEF2/SRF (red) and CREB (blue), are shown. Z-scores of evolutionary conservation are also shown, z-score > 1.64 corresponding to P < 0.05, and z-score > 2.33 corresponding to P < 0.01. (C) Activation of PCDH10 gene expression in rat hippocampal cultures (0, 1, and 6 hours) after membrane depolarization. (D) Activation of NHE9 gene expression in hippocampal cultures (0, 1, 3, and 6 hours) after membrane depolarization with KCl in control lentivirus cultures (blue) and NPAS4 RNAi lentivirus (red).
Fig. 4
Fig. 4
Mutational analysis of NHE9 in nonconsanguineous pedigrees with comorbid autism and epilepsy. (A) Mutational analysis of NHE9 in an AGRE pedigree reveals a nonsense change highly similar to the nonsense mutation in Nhe1 in the slow-wave epilepsy mouse. The AGRE pedigree structure includes two sons with autistic disorder. Patient 1 has comorbid epilepsy, and patient 2 had potential seizures at a younger age but does not currently carry the diagnosis of epilepsy. The mother does not have autism but is reported to have had a speech delay as a child (represented by a half-shading). Both patients and the mother carry the nonsense change. Sequence traces demonstrate the heterozygous C→T transition in Exon 11. This transition occurs at a CpG position consistent with a mutation at a methylated CpG. (B) Sequence trace indicating the position and consequences of the C→T transition. The CGA→TGA transition results in a change from an arginine residue at position 423 to a stop codon. The lower trace demonstrates that the position of this nonsense change in NHE9 occurs in a similar position as the causative, null missense mutation in Nhe1 in the slow-wave epilepsy mouse. (C) Nonsense mutations in the last extracellular loop of NHE proteins: NHE9 in patients with comorbid autism and epilepsy, and Nhe1 in the slow-wave epilepsy mouse. The human nonsense change was not found in greater than 3800 control chromosomes. Complete resequencing of all exons and exon-intron boundaries in a fivefold excess (480) of controls revealed no nonsense changes (table S6).

Comment in

  • Genetics. Insights into the pathogenesis of autism.
    Sutcliffe JS. Sutcliffe JS. Science. 2008 Jul 11;321(5886):208-9. doi: 10.1126/science.1160555. Science. 2008. PMID: 18621658 No abstract available.
  • Autistic phenotype from MEF2C knockout cells.
    Lipton SA, Li H, Zaremba JD, McKercher SR, Cui J, Kang YJ, Nie Z, Soussou W, Talantova M, Okamoto S, Nakanishi N. Lipton SA, et al. Science. 2009 Jan 9;323(5911):208. doi: 10.1126/science.323.5911.208b. Science. 2009. PMID: 19131610 No abstract available.

References

    1. Fombonne E. J Autism Dev Disord. 2003;33:365. - PubMed
    1. Canitano R. Eur Child Adolesc Psychiatry. 2006;16:61. - PubMed
    1. Risch N, et al. Am J Hum Genet. 1999;65:493. - PMC - PubMed
    1. Szatmari P, et al. Nat Genet. 2007;39:319. - PMC - PubMed
    1. Vorstman JA, et al. Mol Psychiatry. 2006;11:1. - PubMed

Publication types

MeSH terms