. 2008 Jul 15;105(28):9610-5.
doi: 10.1073/pnas.0803189105. Epub 2008 Jul 10.

Subnanometer-resolution electron cryomicroscopy-based domain models for the cytoplasmic region of skeletal muscle RyR channel

Affiliations

Subnanometer-resolution electron cryomicroscopy-based domain models for the cytoplasmic region of skeletal muscle RyR channel

Irina I Serysheva et al. Proc Natl Acad Sci U S A. .

Abstract

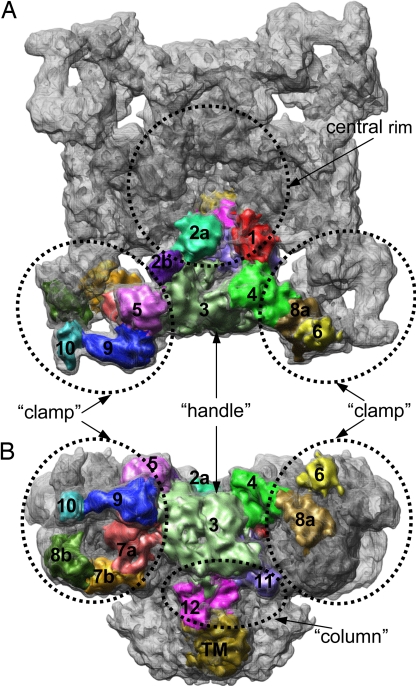
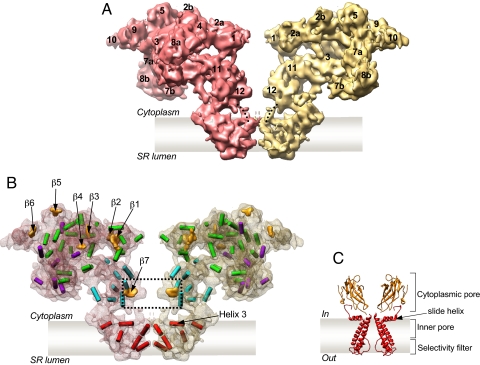
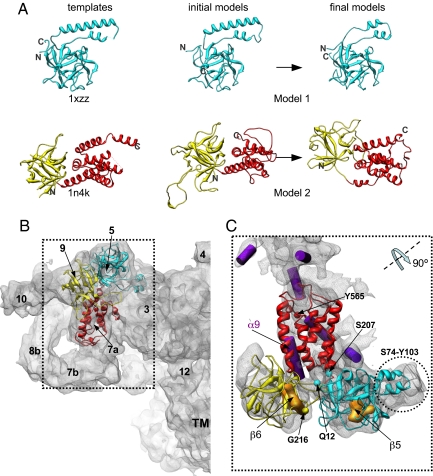
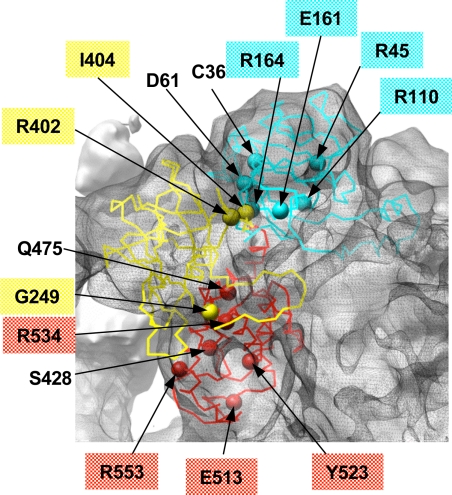
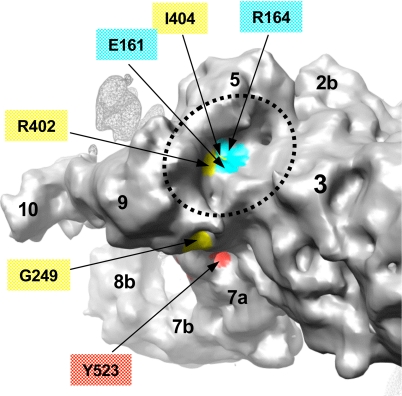
The skeletal muscle Ca(2+) release channel (RyR1), a homotetramer, regulates the release of Ca(2+) from the sarcoplasmic reticulum to initiate muscle contraction. In this work, we have delineated the RyR1 monomer boundaries in a subnanometer-resolution electron cryomicroscopy (cryo-EM) density map. In the cytoplasmic region of each RyR1 monomer, 36 alpha-helices and 7 beta-sheets can be resolved. A beta-sheet was also identified close to the membrane-spanning region that resembles the cytoplasmic pore structures of inward rectifier K(+) channels. Three structural folds, generated for amino acids 12-565 using comparative modeling and cryo-EM density fitting, localize close to regions implicated in communication with the voltage sensor in the transverse tubules. Eleven of the 15 disease-related residues for these domains are mapped to the surface of these models. Four disease-related residues are found in a basin at the interfaces of these regions, creating a pocket in which the immunophilin FKBP12 can fit. Taken together, these results provide a structural context for both channel gating and the consequences of certain malignant hyperthermia and central core disease-associated mutations in RyR1.


Conflict of interest statement

The authors declare no conflict of interest.

Figures

Fig. 1.
Fig. 1.
A 9.6-Å resolution cryo-EM density map of RyR1 in closed state. The map is displayed at the threshold level corresponding to channel molecular mass of ∼2.3 MDa and viewed from cytoplasm (A) and in a side view (B). Subregions are shown within one of the RyR1 subunits. The numbering of subregions is adopted according to a previous convention except with finer divisions (43). A subregion is interpreted as compact protein density, and the boundary of subregion tends to be weakly connected with its adjacent densities. A subregion may thus consist of a single/multiple protein fold or of a part of a protein fold. Poorly connected densities between subregions 6 and 8a and between 10 and 8b may be hinges between subregions with high local structural flexibility. The individual subregions are mapped into the distinct morphological units: clamp is formed by subregions 5, 7a, 7b, 8b, 9, and 10 from one monomer and by subregions 6 and 8a from adjacent subunit; handle is formed by subregions 3 and 4; the central rim is formed by subregions 1, 2a, and 2b; and column is formed by subregions 11 and 12.
Fig. 2.
Fig. 2.
Secondary structure elements in the structure of RyR1. (A) Two opposing RyR1 subunits from the tetramer are shown in a side view; thus, two different faces of the RyR1 subunit are seen. Subregions are numbered. Note that densities corresponding to subregion 6 are missing at the chosen high threshold. (B) Two subunits are shown as semitransparent surfaces with identified secondary structure elements. α-Helices are annotated as cylinders colored according to their locations in the map: red, TM region; green, central part of the CY region; purple, clamps; cyan, column region. β-Sheets are shown as orange surfaces. Note that a substantial fraction of the density is not assigned in this interpretation probably because of the structural flexibility or limited resolution. A dashed line indicates β-sheets in the column region that are connected with the TM region through bridging densities marked with dotted lines in A. (C) X-ray structure of KirBac1.1 channel; two subunits are removed to see the structural elements in the conduction pathway in the KirBac1.1 (11) (see also Fig. S1).
Fig. 3.
Fig. 3.
Localization of homology models for the N-terminal region of the RyR1 in the 3D map. (A) Comparative models for the N-terminal region of RyR1 and corresponding structural templates. Model 1 (residues Q12–S207) is shown with cyan ribbon; model 2 is composed of two parts, shown with yellow (residues G216–T407) and red (residues A408–Y565) ribbons. Two parts of model 2 were built and refined independently to obtain better fits to the cryo-EM map. Final models were obtained through refinement of initial models using Moulder-EM (22). Dashed lines in template structures indicate regions that were not resolved in original x-ray structures (19). (B) The RyR1 monomer is shown in a side view along with homology models docked to the clamp region. Subregions are numbered. (C) Refined homology models are shown fitted within the density region segmented from the 9.6-Å map. The segmented density region is displayed in the orientation derived from its position in B by rotation to ∼90° around the axis as shown. SSEHunter-identified α-helices and β-sheets are shown with purple cylinders and yellow solid densities, respectively. N- and C-terminal residues in both models are indicated.
Fig. 4.
Fig. 4.
Mapping of MH/CCD-linked residues onto the homology models for the N-terminal region of RyR1. Model 1 (cyan) and the model 2 (red and yellow) are shown docked within the EM density map displayed with a mesh. MH/CCD-associated residues are shown with spheres and are labeled. Labels highlighted with color mark residues exposed on the protein surface.
Fig. 5.
Fig. 5.
Identification of MH/CCD-linked residues in the FKBP12 binding pocket. The surface of the clamp in RyR1 is color-coded based on location of residues associated with MH and CCD mutations in the N-terminal homology models docked to the 3D map of RyR1. Cyan surface corresponds to residues from model 1, and yellow and red correspond to residues from model 2 (see color code used in Figs. 3 and 4). Putative surface-exposed mutation residues are labeled. The basin between subregions 3, 5, and 9 (indicated with dashed line) is proposed to form the FKBP-12 binding site in RyR1 (31, 32) and is identified to include four surface-exposed MH/CCD mutation sites (E161, R164, R402, and I404). The surface of the adjacent RyR1 subunit is shown with a mesh.

References

    1. Takeshima H, et al. Primary structure and expression from complementary DNA of skeletal muscle ryanodine receptor. Nature. 1989;339:439–445. - PubMed
    1. Zorzato F, et al. Molecular cloning of cDNA encoding human and rabbit forms of the Ca2+ release channel (ryanodine receptor) of skeletal muscle sarcoplasmic reticulum. J Biol Chem. 1990;265:2244–2256. - PubMed
    1. Durham W, Wehrens X, Sood S, Hamilton SL. In: Calcium Signaling and Disease. Carfoli E, Brini M, editors. New York: Springer; 2007. pp. 273–321.
    1. Ludtke SJ, Serysheva II, Hamilton SL, Chiu W. The pore structure of the closed RyR1 channel. Structure (Cambridge) 2005;13:1203–1211. - PMC - PubMed
    1. Samso M, Wagenknecht T, Allen PD. Internal structure and visualization of transmembrane domains of the RyR1 calcium release channel by cryo-EM. Nat Struct Mol Biol. 2005;12:539–544. - PMC - PubMed

Publication types

MeSH terms

Substances

LinkOut - more resources