. 2008 Jul 22;105(29):9886-91.
doi: 10.1073/pnas.0803929105. Epub 2008 Jul 10.

The role of nanostructure in the wetting behavior of mixed-monolayer-protected metal nanoparticles

Affiliations

The role of nanostructure in the wetting behavior of mixed-monolayer-protected metal nanoparticles

A Centrone et al. Proc Natl Acad Sci U S A. .

Abstract

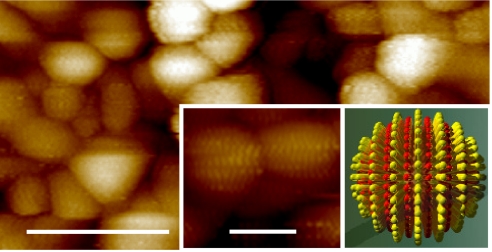
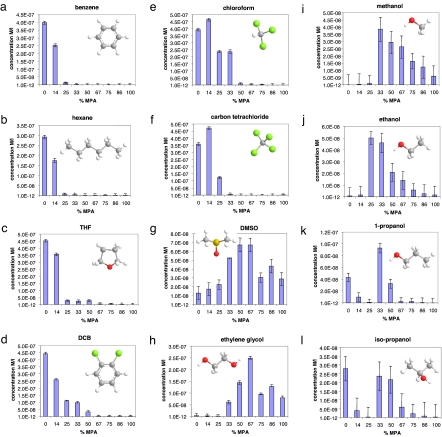
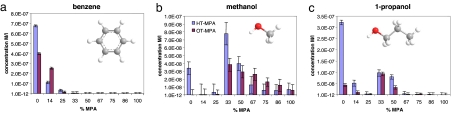
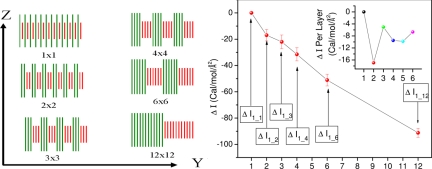
Self-assembled monolayer-protected nanoparticles are promising candidates for applications, such as sensing and drug delivery, in which the molecular ligands' interactions with the surrounding environment play a crucial role. We recently showed that, when gold nanoparticles are coated with a binary mixture of immiscible ligands, ordered ribbon-like domains of alternating composition spontaneously form and that their width is comparable with the size of a single solvent molecule. It is usually assumed that nanoparticles' solubility depends solely on the core size and on the molecular composition of the ligand shell. Here, we show that this is not always the case. We find that the ligand shell morphology affects the solubility of these nanoparticles almost as much as the molecular composition. A possible explanation is offered through a molecular dynamics analysis of the surface energy of monolayers differing only in their domain structure. We find that the surface free energy of such model systems can vary significantly as a function of ordering, even at fixed composition. This combined experimental and theoretical study provides a unique insight into wetting phenomena at the nano- and subnanometer scale.


Conflict of interest statement

The authors declare no conflict of interest.

Figures

Fig. 1.
Fig. 1.
STM image of gold nanoparticles coated with a 2:1 ratio of OT/MPA showing ordered phase separation in their ligand shell. (Scale bar, 25 nm.) (Insets) Close up of nanoparticles showing the encircling, ribbon-like domains (Left) and a corresponding simplified schematic diagram in which the red pillars represent MPA, and the yellow represent OT (Right). (Scale bar, 5 nm.)
Fig. 2.
Fig. 2.
Plot of the saturation concentrations (expressed in M × l−1) for OT/MPA NPs as a function of the ligand shell composition, for NPs dissolved in various solvents: benzene (a), hexane (b), THF (c), DCB (d), chloroform (e), carbon tetrachloride (f), DMSO (g), ethylene glycol (h), methanol (i), ethanol (j), 1-propanol (k), and isopropanol (l). Error bars are the largest variation in concentration observed for different spectra on the same sample and/or on samples with the same composition prepared on different occasions (they account for instrumental, dilution, and sample-preparation uncertainties). The molecular structures of the solvents used have the following color code: carbon (gray), hydrogen (white), oxygen (red), sulfur (yellow), and chlorine (green).
Fig. 3.
Fig. 3.
Plots of the saturation concentrations for HT/MPA NPs (blue bars) and OT-MPA NPs (purple bars) dissolved in various solvents: benzene (a), methanol (b), and 1-propanol (c). Error bars are the largest variation in concentration observed for different spectra on the same sample and/or on samples with the same composition prepared on different occasions (they account for instrumental, dilution, and sample-preparation uncertainties). The molecular structures of the solvents used have the following color code: carbon (gray), hydrogen (white), and oxygen (red).
Fig. 4.
Fig. 4.
Plot of the surface energy dependence on structure at the nanoscale. (Left) Surface morphologies studied in the present work; a superlattice convention is adopted, where a n × m surface has n rows of alkane intercalated by m rows of acid—a 1 × 1 system has 12 repeating units of one alkane and one acid chain, a 2 × 2 system has 6 repeating units of two alkane and two acid chains, a 3 × 3 system has 4 repeating units of three alkane and three acid chains, and so on. (Right) Change in interfacial free energy as a function of surface morphology. (Inset) Change in interfacial free energy per layer added to the alkane and acid part of the surface (point 2 corresponds to the change in interfacial free energy going from 1 × 1 to 2 × 2, point 3 corresponds to the change in interfacial free energy going from 2 × 2 to 3 × 3, point 4 corresponds to the change in interfacial free energy going from 3 × 3 to 4 × 4, point 5 corresponds to the change in interfacial free energy going from 4 × 4 to 6 × 6 divided by 2 (because 2 layers are added going from 4 × 4 to 6 × 6), and point 6 corresponds to the change in interfacial free energy going from 6 × 6 to 12 × 12 divided by 6 (see Table S3).

References

    1. Templeton AC, Wuelfing MP, Murray RW. Monolayer protected cluster molecules. Acc Chem Res. 2000;33:27–36. - PubMed
    1. Daniel MC, Astruc D. Gold nanoparticles: Assembly, supramolecular chemistry, quantum-size-related properties, and applications toward biology, catalysis, and nanotechnology. Chem Rev. 2004;104:293–346. - PubMed
    1. Thomas KG, Kamat PV. Chromophore-functionalized gold nanoparticles. Acc Chem Res. 2003;36:888–898. - PubMed
    1. Shipway AN, Katz E, Willner I. Nanoparticle arrays on surfaces for electronic, optical, and sensor applications. ChemPhysChem. 2000;1:18–52. - PubMed
    1. Jimenez VL, Leopold MC, Mazzitelli C, Jorgenson JW, Murray RW. HPLC of monolayer-protected gold nanoclusters. Anal Chem. 2003;75:199–206. - PubMed

LinkOut - more resources