. 2008 Oct;95(8):4034-44.
doi: 10.1529/biophysj.108.131342. Epub 2008 Jul 11.

Stability of adhesion clusters and cell reorientation under lateral cyclic tension

Affiliations

Stability of adhesion clusters and cell reorientation under lateral cyclic tension

Dong Kong et al. Biophys J. 2008 Oct.

Abstract

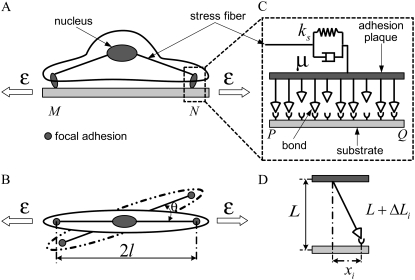
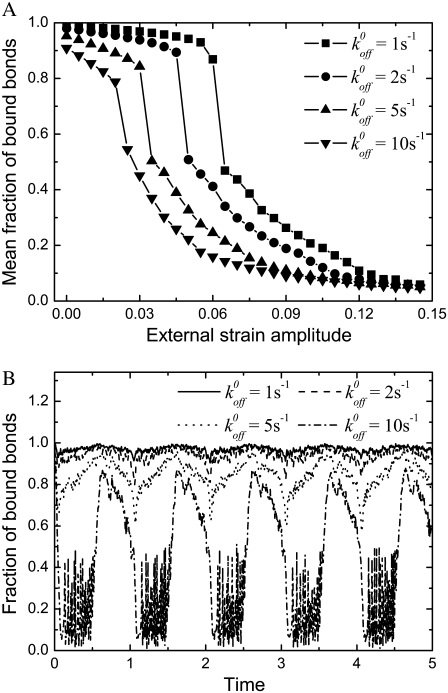
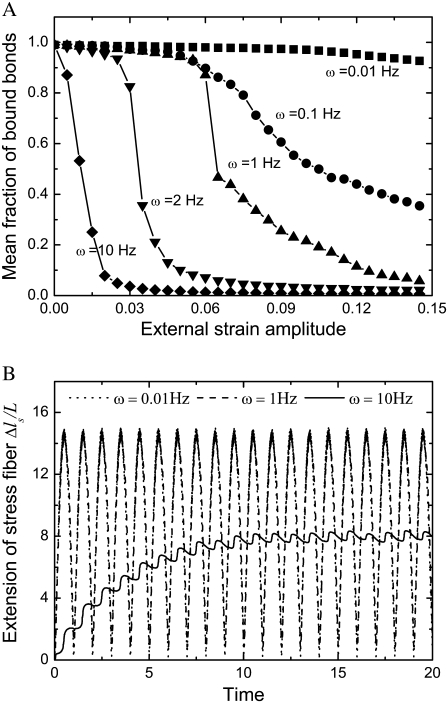
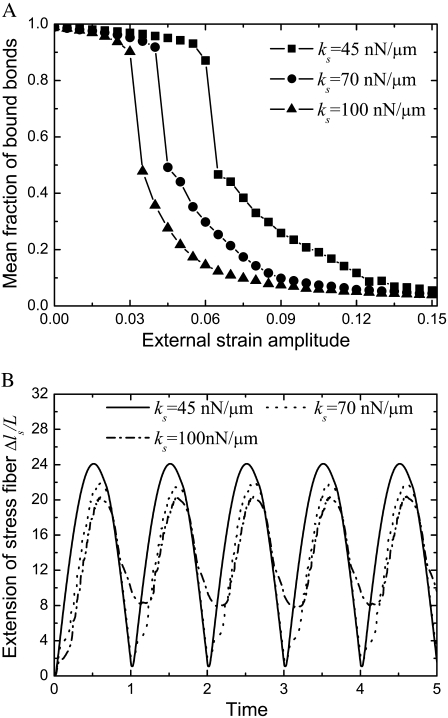
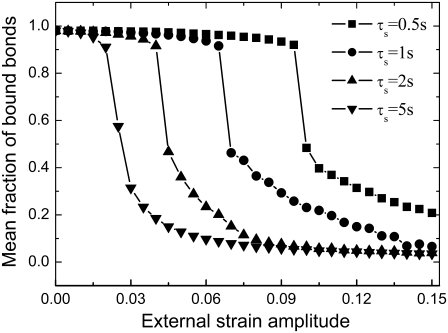
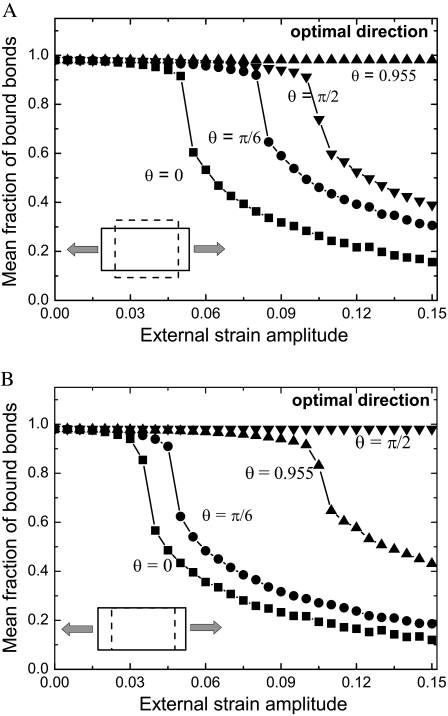
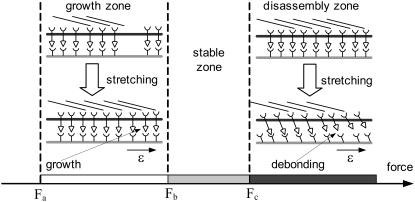
This work is motivated by experimental observations that cells on stretched substrate exhibit different responses to static and dynamic loads. A model of focal adhesion that can consider the mechanics of stress fiber, adhesion bonds, and substrate was developed at the molecular level by treating the focal adhesion as an adhesion cluster. The stability of the cluster under dynamic load was studied by applying cyclic external strain on the substrate. We show that a threshold value of external strain amplitude exists beyond which the adhesion cluster disrupts quickly. In addition, our results show that the adhesion cluster is prone to losing stability under high-frequency loading, because the receptors and ligands cannot get enough contact time to form bonds due to the high-speed deformation of the substrate. At the same time, the viscoelastic stress fiber becomes rigid at high frequency, which leads to significant deformation of the bonds. Furthermore, we find that the stiffness and relaxation time of stress fibers play important roles in the stability of the adhesion cluster. The essence of this work is to connect the dynamics of the adhesion bonds (molecular level) with the cell's behavior during reorientation (cell level) through the mechanics of stress fiber. The predictions of the cluster model are consistent with experimental observations.


Figures

FIGURE 1
FIGURE 1
Schematic illustration of the side view (A) and top view (B) of the adhered cell under external strain. The dashed line in B denotes the adhered cell with a different orientation, characterized by angle θ. (C) Magnification of the adhesion cluster showing how the adhesion plaque (upper plate) couples the adhesion bonds and the stress fiber. The semimajor axis of the adhered cell is kept constant at l = 10 μm. (D) Illustration of the bond deformation under lateral force.
FIGURE 2
FIGURE 2
Flow chart of the numerical scheme for calculations of the mean fraction of bound bonds of the adhesion cluster under cyclic lateral force.
FIGURE 3
FIGURE 3
(A) Dependence of the mean fraction of bound bonds on the external strain, formula image at a different reverse rate constant, formula image In the calculation, we chose formula image and formula image (B) Evolution of the fraction of bound bonds as a function of time at formula image with formula image and 10 (top to bottom). The larger the formula image the larger is the fluctuation of the fraction of bound bonds.
FIGURE 4
FIGURE 4
(A) Dependence of the mean fraction of bound bonds on the external strain, formula image at different frequency, ω. (B) Extension of the stress fiber as a function of time. In the calculation, we chose formula image and formula image
FIGURE 5
FIGURE 5
(A) Effect of the stiffness of the stress fiber on the stability of the adhesion cluster. In the calculation, we chose formula image and formula image (B) Extension of the stress fiber as a function of time at formula image
FIGURE 6
FIGURE 6
Effect of the relaxation time of the stress fiber on the stability of the adhesion cluster. In the calculation, we chose formula image and formula image
FIGURE 7
FIGURE 7
Dependence of the mean fraction of bound bonds on the external strain, formula image at different angle θ. In the calculation, we chose formula image and formula image (A) v = 0.5. (B) v = 0. Insets show the stretching modes, i.e., simple elongation and pure uniaxial stretching, respectively.
FIGURE 8
FIGURE 8
Force scale diagram for the growth and disassembly of focal adhesions. The growth zone denotes the force range for FA growth, formula image described by Nicolas et al. (23), and the disassembly zone corresponds to formula image (the force range formula image corresponds to the stable zone) in the model described here. In the growth zone, the force-induced growth of FA originates from the addition of a new integrin molecule and its associated intracellular proteins to the FA through an “integrinC-integrinC” interaction (“intracelluar” interaction). However, in the disassembly zone, disassembly of the FA is caused by disassociation of the adhesion molecules on cells (integrin receptors) from their ligands on the ECM (“cell-ECM” interaction).

Similar articles

Cited by

References

    1. Buck, R. C. 1980. Reorientation response of cells to repeated stretch and recoil of the substratum. Exp. Cell Res. 127:470–474. - PubMed
    1. Dartsch, P., and H. Hammerle. 1986. Orientation response of arterial smooth muscle cells to mechanical stimulation. Eur. J. Cell Biol. 41:339–346. - PubMed
    1. Wang, J. H. C., E. S. Grood, J. Florer, and R. Wenstrup. 2000. Alignment and proliferation of MC3T3-E1 osteoblasts in microgrooved silicone substrata subjected to cyclic stretching. J. Biomech. 33:729–735. - PubMed
    1. Neidlinger-Wilke, C., E. S. Grood, J. H. C. Wang, R. A. Brand, and L. Claes. 2001. Cell alignment is induced by cyclic changes in cell length: studies of cells grown in cyclically stretched substrates. J. Orthop. Res. 19:286–293. - PubMed
    1. Moretti, M., A. Prina-Mello, A. J. Reid, V. Barron, and P. J. Prendergast. 2004. Endothelial cell alignment on cyclically-stretched silicone surfaces. J. Mater. Sci. Mater. Med. 15:1159–1164. - PubMed

Publication types

LinkOut - more resources