Stochastic simulation of enzyme-catalyzed reactions with disparate timescales
- PMID: 18621809
- PMCID: PMC2553150
- DOI: 10.1529/biophysj.108.129155
Stochastic simulation of enzyme-catalyzed reactions with disparate timescales
Abstract
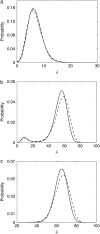
Many physiological characteristics of living cells are regulated by protein interaction networks. Because the total numbers of these protein species can be small, molecular noise can have significant effects on the dynamical properties of a regulatory network. Computing these stochastic effects is made difficult by the large timescale separations typical of protein interactions (e.g., complex formation may occur in fractions of a second, whereas catalytic conversions may take minutes). Exact stochastic simulation may be very inefficient under these circumstances, and methods for speeding up the simulation without sacrificing accuracy have been widely studied. We show that the "total quasi-steady-state approximation" for enzyme-catalyzed reactions provides a useful framework for efficient and accurate stochastic simulations. The method is applied to three examples: a simple enzyme-catalyzed reaction where enzyme and substrate have comparable abundances, a Goldbeter-Koshland switch, where a kinase and phosphatase regulate the phosphorylation state of a common substrate, and coupled Goldbeter-Koshland switches that exhibit bistability. Simulations based on the total quasi-steady-state approximation accurately capture the steady-state probability distributions of all components of these reaction networks. In many respects, the approximation also faithfully reproduces time-dependent aspects of the fluctuations. The method is accurate even under conditions of poor timescale separation.
Figures





Similar articles
-
Stochastic chemical kinetics and the total quasi-steady-state assumption: application to the stochastic simulation algorithm and chemical master equation.J Chem Phys. 2008 Sep 7;129(9):095105. doi: 10.1063/1.2971036. J Chem Phys. 2008. PMID: 19044893
-
On the Validity of the Stochastic Quasi-Steady-State Approximation in Open Enzyme Catalyzed Reactions: Timescale Separation or Singular Perturbation?Bull Math Biol. 2021 Nov 26;84(1):7. doi: 10.1007/s11538-021-00966-5. Bull Math Biol. 2021. PMID: 34825985 Free PMC article.
-
Zero-order ultrasensitivity: a study of criticality and fluctuations under the total quasi-steady state approximation in the linear noise regime.J Theor Biol. 2014 Mar 7;344:1-11. doi: 10.1016/j.jtbi.2013.11.014. Epub 2013 Dec 3. J Theor Biol. 2014. PMID: 24309434
-
Misuse of the Michaelis-Menten rate law for protein interaction networks and its remedy.PLoS Comput Biol. 2020 Oct 22;16(10):e1008258. doi: 10.1371/journal.pcbi.1008258. eCollection 2020 Oct. PLoS Comput Biol. 2020. PMID: 33090989 Free PMC article. Review.
-
A tutorial introduction to stochastic simulation algorithms for belief networks.Artif Intell Med. 1993 Aug;5(4):315-40. doi: 10.1016/0933-3657(93)90020-4. Artif Intell Med. 1993. PMID: 8220686 Review.
Cited by
-
Beyond homogeneity: Assessing the validity of the Michaelis-Menten rate law in spatially heterogeneous environments.PLoS Comput Biol. 2024 Jun 6;20(6):e1012205. doi: 10.1371/journal.pcbi.1012205. eCollection 2024 Jun. PLoS Comput Biol. 2024. PMID: 38843305 Free PMC article.
-
Beyond the Michaelis-Menten equation: Accurate and efficient estimation of enzyme kinetic parameters.Sci Rep. 2017 Dec 5;7(1):17018. doi: 10.1038/s41598-017-17072-z. Sci Rep. 2017. PMID: 29208922 Free PMC article.
-
The relationship between stochastic and deterministic quasi-steady state approximations.BMC Syst Biol. 2015 Nov 23;9:87. doi: 10.1186/s12918-015-0218-3. BMC Syst Biol. 2015. PMID: 26597159 Free PMC article.
-
Adaptive deployment of model reductions for tau-leaping simulation.J Chem Phys. 2015 May 28;142(20):204108. doi: 10.1063/1.4921638. J Chem Phys. 2015. PMID: 26026435 Free PMC article.
-
Stochastic hybrid modeling of intracellular calcium dynamics.J Chem Phys. 2010 Oct 28;133(16):165101. doi: 10.1063/1.3496996. J Chem Phys. 2010. PMID: 21033822 Free PMC article.
References
-
- Gillespie, D. T. 1976. A general method for numerically simulating the stochastic time evolution of coupled chemical reactions. J. Comput. Phys. 22:403–434.
-
- Gillespie, D. T. 1977. Exact stochastic simulation of coupled chemical reactions. J. Phys. Chem. 81:2340–2361.
-
- Gillespie, D. T. 2001. Approximate accelerated stochastic simulation of chemically reacting systems. J. Chem. Phys. 115:1716–1733.
-
- Cao, Y., L. R. Petzold, M. Rathinam, and D. T. Gillespie. 2004. The numerical stability of leaping methods for stochastic simulation of chemically reacting systems. J. Chem. Phys. 121:12169–12178. - PubMed
-
- Rathinam, M., L. R. Petzold, Y. Cao, and D. T. Gillespie. 2003. Stiffness in stochastic chemically reacting systems: The implicit tau-leaping method. J. Chem. Phys. 119:12784–12794. - PubMed
MeSH terms
Substances
Grants and funding
LinkOut - more resources
Full Text Sources

