. 2008 Oct;95(7):3497-509.
doi: 10.1529/biophysj.107.120840. Epub 2008 Jul 11.

Charged surface area of maurocalcine determines its interaction with the skeletal ryanodine receptor

Affiliations

Charged surface area of maurocalcine determines its interaction with the skeletal ryanodine receptor

Balázs Lukács et al. Biophys J. 2008 Oct.

Abstract

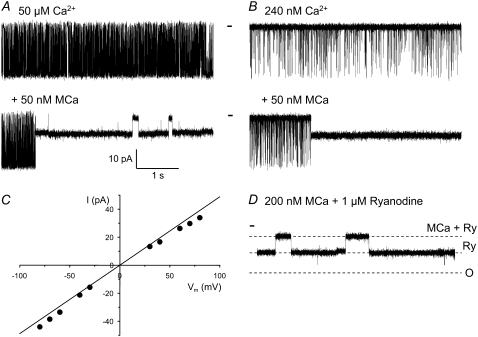
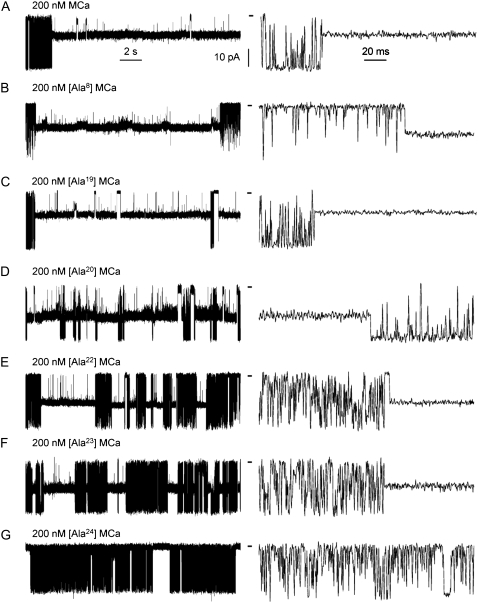
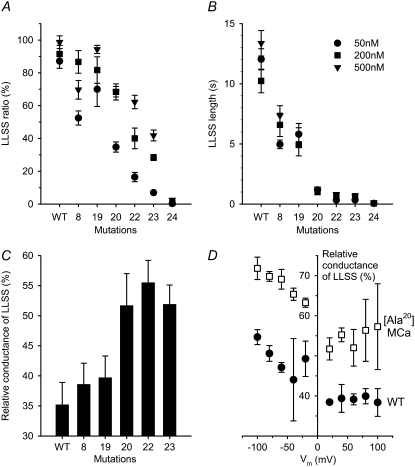
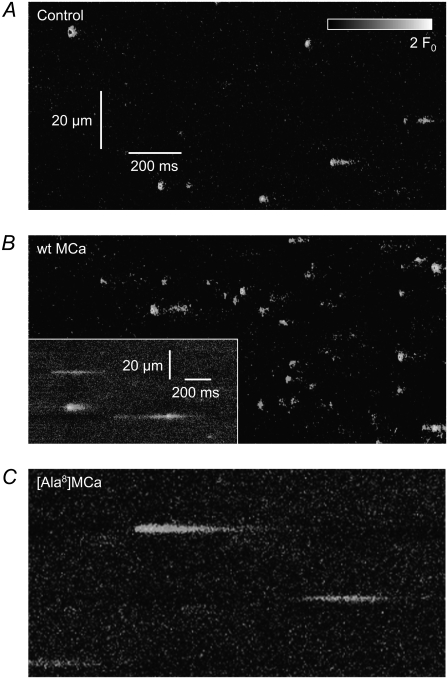
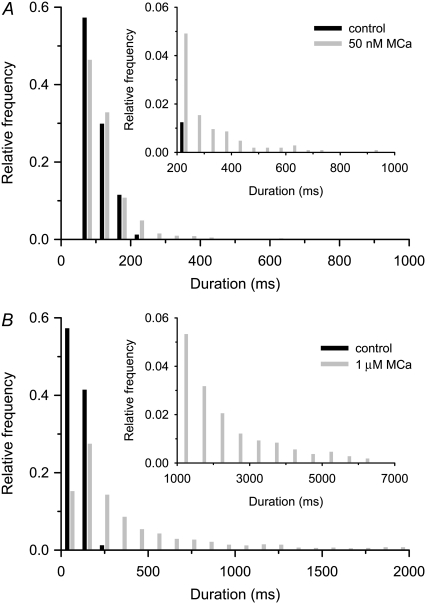
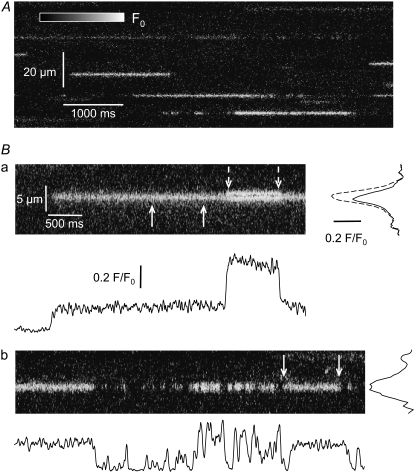
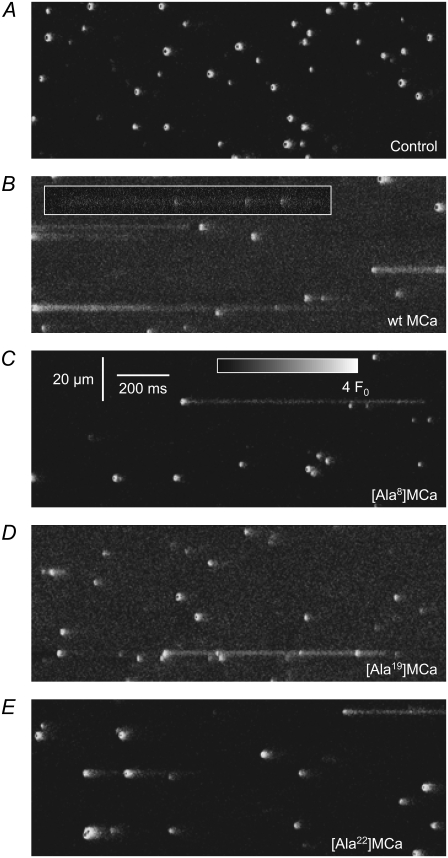
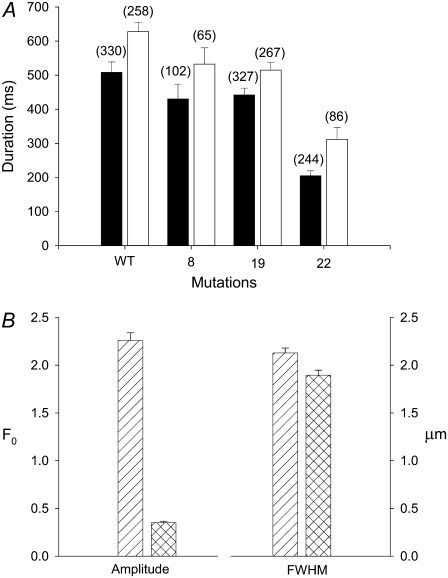
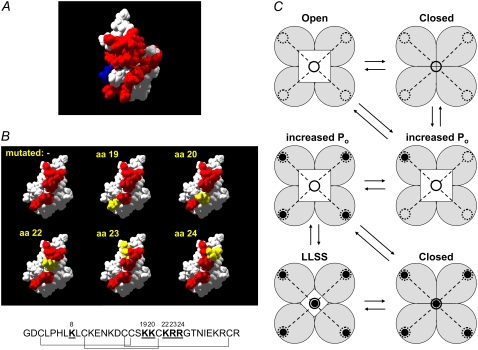
The 33 amino acid scorpion toxin maurocalcine (MCa) has been shown to modify the gating of the skeletal-type ryanodine receptor (RyR1). Here we explored the effects of MCa and its mutants ([Ala(8)]MCa, [Ala(19)]MCa, [Ala(20)]MCa, [Ala(22)]MCa, [Ala(23)]MCa, and [Ala(24)]MCa) on RyR1 incorporated into artificial lipid bilayers and on elementary calcium release events (ECRE) in rat and frog skeletal muscle fibers. The peptides induced long-lasting subconductance states (LLSS) on RyR1 that lasted for several seconds. However, their average length and frequency were decreased if the mutation was placed farther away in the 3D structure from the critical (24)Arg residue. The effect was strongly dependent on the direction of the current through the channel. If the direction was similar to that followed by calcium during release, the peptides were 8- to 10-fold less effective. In fibers long-lasting calcium release events were observed after the addition of the peptides. The average length of these events correlated well with the duration of LLSS. These data suggest that the effect of the peptide is governed by the large charged surface formed by residues Lys(20), Lys(22), Arg(23), Arg(24), and Lys(8). Our observations also indicate that the results from bilayer experiments mimic the in situ effects of MCa on RyR1.


Figures

FIGURE 1
FIGURE 1
Effect of MCa and ryanodine on the calcium channel. The solubilized ryanodine receptor of the rat was incorporated into a lipid bilayer and the channel current was recorded under voltage clamp conditions using +55 mV as the holding potential at two different cis [Ca2+] (50 μM, left; 240 nM, right). The charge carrier was 250 mM KCl; channel openings are represented by downward deflections. The closed state of the channel is marked between the current traces using the symbol —. (A and B) Single-channel recordings obtained under control conditions and in the presence of 200 nM MCa demonstrating the LLSS, lasting for several seconds, for the latter. (C) Current-voltage relationship for the full conductance state calculated from records in the presence of MCa. (D) Recording in the presence of 200 nM MCa and 1 μM ryanodine (50 μM [Ca2+] cis). The ryanodine-induced specific half conductance state is labeled as Ry, whereas the MCa-induced state in the presence of ryanodine is labeled as MCa + Ry. For reference the full open state is also marked with O.
FIGURE 2
FIGURE 2
Effect of MCa and its mutants on the RyR1 of the rat. (A–G) Representative current traces in the presence of MCa (A) and its mutants (B–G; as marked). Experimental conditions are identical to those for Fig. 1 A. The traces in the left and right columns show identical single-channel recordings obtained using different time scales to better visualize the effects of different mutants. Between the two columns the closed state is marked as —. Note that when the place of the mutation is closer to the critical residue 24Arg, the length and the frequency of LLSS decrease while the single-channel conductance corresponding to the full openings of the channel does not change.
FIGURE 3
FIGURE 3
Parameters of the LLSS differ for different mutants. (A and B) Single-channel records were taken at 50 nM (•),200 nM (▪), and 500 nM (▾) peptide concentrations, and the LLSS ratio (A) and average length of the LLSS events (B) were determined. The LLSS ratio was calculated as the ratio of the time spent in the subconductance state over the total time and expressed as percentage. Note that when the site of the mutation is placed more and more distant from the critical residue 24Arg, the channel spends less and less time in the LLSS state. Note also that although the concentration of the peptide did influence the LLSS ratio, it had little effect, if any, on its average length. (C) Relative conductance of LLSS for the different mutants was calculated by normalizing the conductance of LLSS to that of the full conductance state. Measurements for panels A–C were taken at the holding potential of +55 mV; each symbol represents the mean of at least 20 events taken from at least eight bilayers. (D) Voltage dependence of the relative conductance of LLSS for the wild-type MCa (•; 25 nM) and the [Ala22]MCa mutant (□; 250 nM). Values are expressed as a percentage of the full conductance state in panels C and D.
FIGURE 4
FIGURE 4
Effect of wild-type and mutant MCa on calcium release events in rat skeletal muscle fibers. Line-scan images in control (A) and in the presence of wild-type MCa (B) and [Ala8]MCa mutant (C) in saponin-skinned rat skeletal muscle fibers. Scanning was made parallel with the fiber axis. Images were corrected for background fluorescence (F/F0) and pseudo-colored. Note the larger number of long-lasting embers as compared to control in the presence of both types of the peptide. The inset shows that wild-type MCa causes similar long events as the [Ala8]MCa mutant.
FIGURE 5
FIGURE 5
Relative distribution of ember durations. (A) Event durations were measured under control conditions (black bars) and in the presence of 50 nM MCa (gray bars). Note the presence of events longer than 250 ms in the presence of the peptide, which were not observed under control conditions. Inset shows the distribution at an expanded y-scale for better visualization of the longer events. (B) Event durations in the absence and presence of 1 μM of MCa. Note the clear alteration in the shape of the distribution in the presence of the peptide. Inset again shows the distribution at an extended y-scale.
FIGURE 6
FIGURE 6
Long-lasting calcium events caused by the [Ala19]MCa mutant in rat skeletal muscle fibers. (A) Pseudo-colored line-scan image taken in the presence of [Ala19]MCa. The same scanning direction and image correction were applied as in Fig. 4, but the length of acquisition was eight times longer. Note the very long event durations and the presence of endless events on either side of the image. (B, a) A representative ember with a secondary opening taken from a long scan. (B, b) A representative event demonstrating the successive reopenings of the channel. The traces below the images show the average of five neighboring lines at the middle of the event, and the traces next to the images represent the spatial spread of the event calculated by averaging the lines between the times marked by white arrows. The solid and dashed traces in panel B, a correspond to the time windows marked by solid and dashed arrows with calculated FWHMs of 1.54 and 1.44 μm during and before the secondary opening, respectively.
FIGURE 7
FIGURE 7
Effect of wild-type and mutant MCa on calcium release events in frog skeletal muscle fibers. Pseudo-colored line-scan images under control conditions (A) and in the presence of wild-type MCa (B) and [Ala8]MCa (C), [Ala19]MCa (D), and [Ala22]MCa (E) mutants in frog skeletal muscle fibers. The same scanning direction and image correction were applied as in Fig. 4. Note the decreased number of long-lasting embers in the presence of [Ala22]MCa as compared to those measured in the presence of wild-type MCa and the other mutants. The inset in panel B displays a rare event in which the long opening was not preceded by a spark.
FIGURE 8
FIGURE 8
Effect of MCa and its mutants on the parameters of calcium release events. (A) The average length of the events measured in the presence of wild-type MCa and its different mutants calculated from images similar to those presented in Fig. 7. Empty bars represent averages measured in the presence of 50 nM, and filled bars give values in the presence of 100 nM of the peptides. The numbers above the bars give the number of events included in the average. Only those events whose lengths could reliably be estimated were considered. Note the fewer number of events for the [Ala22]MCa mutant. (B) The parameters of the leading spark (hatched bars) and the trailing ember (cross-hatched bars) for selected large events (n = 66) measured in the presence of the wild-type peptide (50 nM). In the case of the trailing ember, the average amplitude is given.
FIGURE 9
FIGURE 9
3D structure and proposed binding sites of MCa. (A) Putative 3D structure of MCa with the basic amino acids (aa) colored red, the acidic aa colored blue, and all others colored white. The presented 3D structure is based on NMR measurements reflecting the structure of the molecule dissolved in an aqueous phase (29). (B) Predicted 3D structure of the wild-type and mutated peptides together with the aa sequence. In the first image, the red color shows positively charged aa whose mutations were tested in this study; all other aa are in white. The yellow color in all subsequent images represents the actually mutated aa; these were only recolored without recalculation of the structure. (C) Proposed model for the MCa binding sites on the functional channel unit. Each RyR1 monomer has one (identical) binding site (dotted circles) and the tetramer has an extra—collective—site (solid circle) positioned in the central part of the channel. Open circles represent unoccupied MCa binding sites, and filled circles represent occupied MCa binding sites. The area of the white central square, the pore, is proportional to the conductance of the channel under the given condition.

Similar articles

Cited by

References

    1. Tsugorka, A., E. Rios, and L. A. Blatter. 1995. Imaging elementary events of calcium release in skeletal muscle cells. Science. 269:1723–1726. - PubMed
    1. Klein, M. G., H. Cheng, L. F. Santana, Y. H. Jang, W. J. Lederer, and M. F. Schneider. 1996. Two mechanisms of quantized calcium release in skeletal muscle. Nature. 379:455–458. - PubMed
    1. Gonzalez, A., W. G. Kirsch, N. Shirokova, G. Pizarro, M. D. Stern, and E. Rios. 2000. The park and its ember: separately gated local components of Ca2+ release in skeletal muscle. J. Gen. Physiol. 115:139–157. - PMC - PubMed
    1. Shirokova, N., J. Garcia, and E. Rios. 1998. Local calcium release in mammalian skeletal muscle. J. Physiol. 512:377–384. - PMC - PubMed
    1. Kirsch, W. G., D. Uttenweiler, and R. H. A. Fink. 2001. Spark- and ember-like elementary Ca2+ release events in skinned fibers of adult mammalian skeletal muscle. J. Physiol. 537:379–389. - PMC - PubMed

Publication types

MeSH terms