

A new FRAP/FRAPa method for three-dimensional diffusion measurements based on multiphoton excitation microscopy
- PMID: 18621824
- PMCID: PMC2547427
- DOI: 10.1529/biophysj.108.133637
A new FRAP/FRAPa method for three-dimensional diffusion measurements based on multiphoton excitation microscopy
Abstract
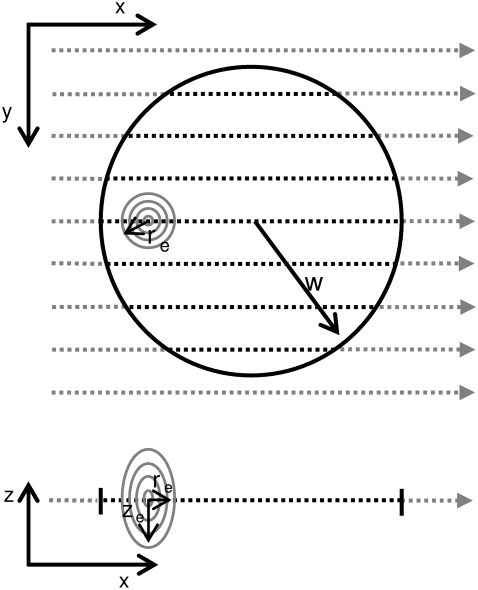
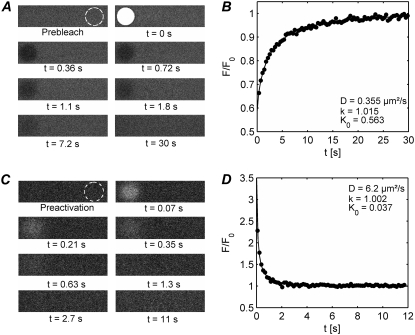
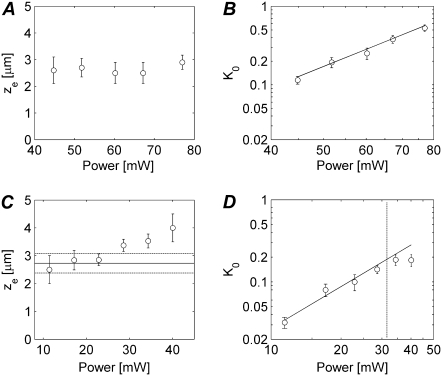
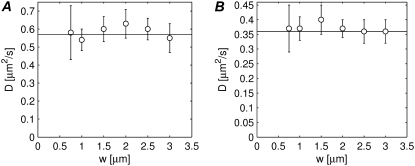
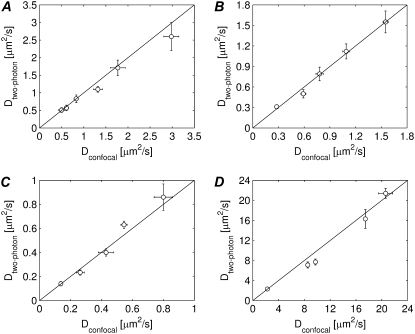
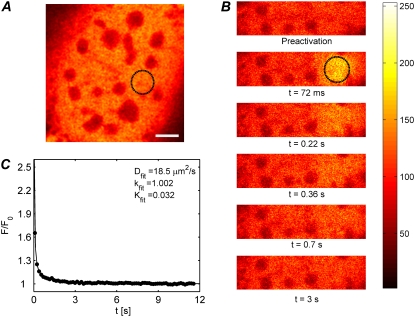
We present a new convenient method for quantitative three-dimensionally resolved diffusion measurements based on the photobleaching (FRAP) or photoactivation (FRAPa) of a disk-shaped area by the scanning laser beam of a multiphoton microscope. Contrary to previously reported spot-photobleaching protocols, this method has the advantage of full scalability of the size of the photobleached area and thus the range of diffusion coefficients, which can be measured conveniently. The method is compatible with low as well as high numerical aperture objective lenses, allowing us to perform quantitative diffusion measurements in three-dimensional extended samples as well as in very small volumes, such as cell nuclei. Furthermore, by photobleaching/photoactivating a large area, diffusion along the optical axis can be measured separately, which is convenient when studying anisotropic diffusion. First, we show the rigorous mathematical derivation of the model, leading to a closed-form formula describing the fluorescence recovery/redistribution phase. Next, the ability of the multiphoton FRAP method to correctly measure absolute diffusion coefficients is tested thoroughly on many test solutions of FITC-dextrans covering a wide range of diffusion coefficients. The same is done for the FRAPa method on a series of photoactivatable green fluorescent protein solutions with different viscosities. Finally, we apply the method to photoactivatable green fluorescent protein diffusing freely in the nucleus of living NIH-3T3 mouse embryo fibroblasts.
Figures

Similar articles
-
Line FRAP with the confocal laser scanning microscope for diffusion measurements in small regions of 3-D samples.Biophys J. 2007 Mar 15;92(6):2172-83. doi: 10.1529/biophysj.106.099838. Epub 2007 Jan 5. Biophys J. 2007. PMID: 17208970 Free PMC article.
-
Three-dimensional fluorescence recovery after photobleaching with the confocal scanning laser microscope.Biophys J. 2003 Oct;85(4):2240-52. doi: 10.1016/S0006-3495(03)74649-9. Biophys J. 2003. PMID: 14507689 Free PMC article.
-
A nonfitting method using a spatial sine window transform for inhomogeneous effective-diffusion measurements by FRAP.Biophys J. 2011 Jan 19;100(2):507-16. doi: 10.1016/j.bpj.2010.11.080. Biophys J. 2011. PMID: 21244847 Free PMC article.
-
Two-photon microscopy of cells and tissue.Circ Res. 2004 Dec 10;95(12):1154-66. doi: 10.1161/01.RES.0000150593.30324.42. Circ Res. 2004. PMID: 15591237 Review.
-
Fluorescence Recovery after Photobleaching in Colloidal Science: Introduction and Application.ACS Biomater Sci Eng. 2022 Mar 14;8(3):1028-1048. doi: 10.1021/acsbiomaterials.1c01422. Epub 2022 Feb 24. ACS Biomater Sci Eng. 2022. PMID: 35201752 Review.
Cited by
-
Measurement of three-dimensional anisotropic diffusion by multiphoton fluorescence recovery after photobleaching.Ann Biomed Eng. 2014 Mar;42(3):555-65. doi: 10.1007/s10439-013-0939-7. Epub 2013 Nov 19. Ann Biomed Eng. 2014. PMID: 24248560 Free PMC article.
-
Multiscale measurements distinguish cellular and interstitial hindrances to diffusion in vivo.Biophys J. 2009 Jul 8;97(1):330-6. doi: 10.1016/j.bpj.2009.03.064. Biophys J. 2009. PMID: 19580771 Free PMC article.
-
Molecular diffusion and binding analyzed with FRAP.Protoplasma. 2014 Mar;251(2):373-82. doi: 10.1007/s00709-013-0604-x. Epub 2014 Jan 4. Protoplasma. 2014. PMID: 24390250 Review.
-
Beyond analytic solution: Analysis of FRAP experiments by spatial simulation of the forward problem.Biophys J. 2023 Sep 19;122(18):3722-3737. doi: 10.1016/j.bpj.2023.06.013. Epub 2023 Jun 23. Biophys J. 2023. PMID: 37353932 Free PMC article.
-
Methods for characterizing the material properties of biomolecular condensates.Methods Enzymol. 2021;646:143-183. doi: 10.1016/bs.mie.2020.06.009. Epub 2020 Jul 22. Methods Enzymol. 2021. PMID: 33453924 Free PMC article.
References
-
- Sanders, N. N., S. C. De Smedt, and J. Demeester. 2000. The physical properties of biogels and their permeability for macromolecular drugs and colloidal drug carriers. J. Pharm. Sci. 89:835–849. - PubMed
-
- Remaut, K., N. N. Sanders, B. G. De Geest, K. Braeckmans, J. Demeester, and S. C. De Smedt. 2007. Nucleic acid delivery: where material sciences and bio-sciences meet. Mater. Sci. Eng. Rep. 58:117–161.
-
- Chen, Y., B. C. Lagerholm, B. Yang, and K. Jacobson. 2006. Methods to measure the lateral diffusion of membrane lipids and proteins. Methods. 39:147–153. - PubMed
-
- De Smedt, S. C., K. Remaut, B. Lucas, K. Braeckmans, N. N. Sanders, and J. Demeester. 2005. Studying biophysical barriers to DNA delivery by advanced light microscopy. Adv. Drug Deliv. Rev. 57:191–210. - PubMed
-
- Gosch, M., and R. Rigler. 2005. Fluorescence correlation spectroscopy of molecular motions and kinetics. Adv. Drug Deliv. Rev. 57:169–190. - PubMed
Publication types
MeSH terms
Substances
LinkOut - more resources
Full Text Sources
Other Literature Sources
Miscellaneous
