

Control of transcriptional variability by overlapping feed-forward regulatory motifs
- PMID: 18621837
- PMCID: PMC2553142
- DOI: 10.1529/biophysj.108.134064
Control of transcriptional variability by overlapping feed-forward regulatory motifs
Abstract
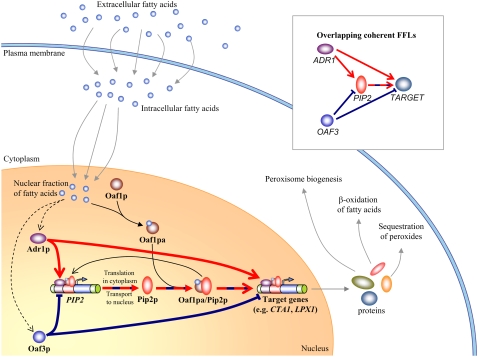
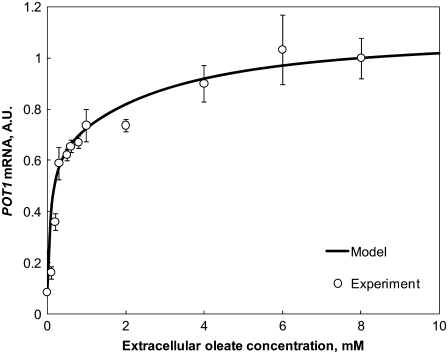
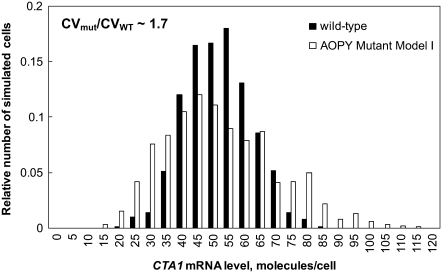
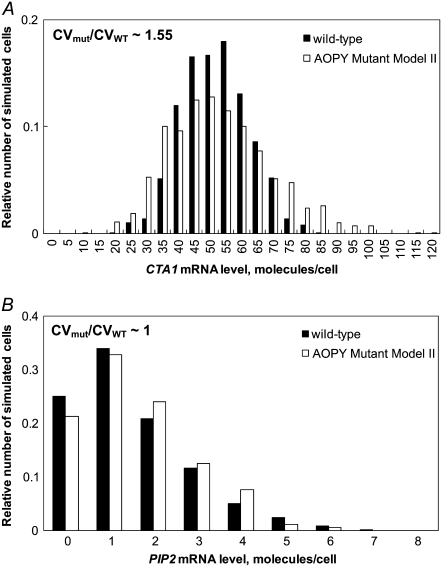
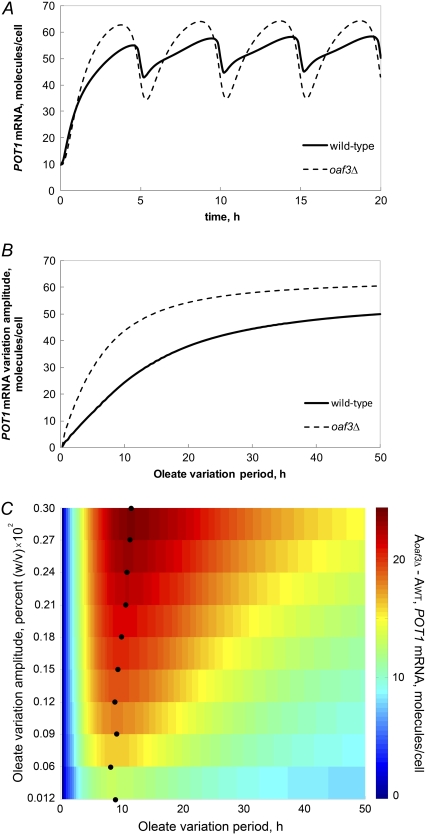
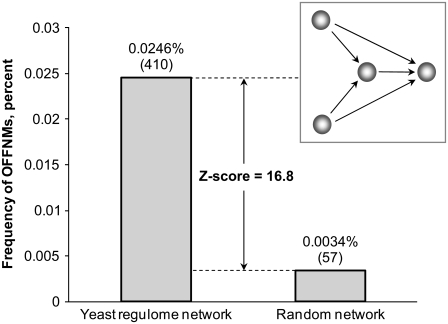
In yeast, beta-oxidation of fatty acids (FAs) takes place in the peroxisome, an organelle whose size and number are controlled in response to environmental cues. The expression of genes required for peroxisome assembly and function is controlled by a transcriptional regulatory network that is induced by FAs such as oleate. The core FA-responsive transcriptional network consists of carbon source-sensing transcription factors that regulate key target genes through an overlapping feed-forward network motif (OFFNM). However, a systems-level understanding of the function of this network architecture in regulating dynamic FA-induced gene expression is lacking. The specific role of the OFFNM in regulating the dynamic and cell-population transcriptional response to oleate was investigated using a kinetic model comprised of four core transcription factor genes (ADR1, OAF1, PIP2, and OAF3) and two reporter genes (CTA1 and POT1) that are indicative of peroxisome induction. Simulations of the model suggest that 1), the intrinsic Adr1p-driven feed-forward loop reduces the steady-state expression variability of target genes; 2), the parallel Oaf3p-driven inhibitory feed-forward loop modulates the dynamic response of target genes to a transiently varying oleate concentration; and 3), heterodimerization of Oaf1p and Pip2p does not appear to have a noise-reducing function in the context of oleate-dependent expression of target genes. The OFFNM is highly overrepresented in the yeast regulome, suggesting that the specific functions described for the OFFNM, or other properties of this motif, provide a selective advantage.
Figures
Similar articles
-
Role of the repressor Oaf3p in the recruitment of transcription factors and chromatin dynamics during the oleate response.Biochem J. 2013 Jan 15;449(2):507-17. doi: 10.1042/BJ20121029. Biochem J. 2013. PMID: 23088601
-
Binding characteristics and regulatory mechanisms of the transcription factors controlling oleate-responsive genes in Saccharomyces cerevisiae.J Biol Chem. 2008 Apr 18;283(16):10264-75. doi: 10.1074/jbc.M708215200. Epub 2008 Feb 19. J Biol Chem. 2008. PMID: 18285336 Free PMC article.
-
Functional analysis of the Zn(2)Cys(6) transcription factors Oaf1p and Pip2p. Different roles in fatty acid induction of beta-oxidation in Saccharomyces cerevisiae.J Biol Chem. 1999 Aug 6;274(32):22208-16. doi: 10.1074/jbc.274.32.22208. J Biol Chem. 1999. PMID: 10428786
-
Saccharomyces cerevisiae PIP2 mediating oleic acid induction and peroxisome proliferation is regulated by Adr1p and Pip2p-Oaf1p.J Biol Chem. 2003 Jul 25;278(30):27605-11. doi: 10.1074/jbc.M304097200. Epub 2003 May 14. J Biol Chem. 2003. PMID: 12748191
-
Transcriptional control of nonfermentative metabolism in the yeast Saccharomyces cerevisiae.Curr Genet. 2003 Jun;43(3):139-60. doi: 10.1007/s00294-003-0381-8. Epub 2003 Apr 25. Curr Genet. 2003. PMID: 12715202 Review.
Cited by
-
Systems cell biology.J Cell Biol. 2014 Sep 15;206(6):695-706. doi: 10.1083/jcb.201405027. J Cell Biol. 2014. PMID: 25225336 Free PMC article. Review.
-
A self-propelled biological process: Plk1-dependent, product-activated feedforward mechanism.Cell Cycle. 2011 Oct 15;10(20):3411-2. doi: 10.4161/cc.10.20.17522. Cell Cycle. 2011. PMID: 22067708 Free PMC article. No abstract available.
-
Role of the histone variant H2A.Z/Htz1p in TBP recruitment, chromatin dynamics, and regulated expression of oleate-responsive genes.Mol Cell Biol. 2009 May;29(9):2346-58. doi: 10.1128/MCB.01233-08. Epub 2009 Mar 9. Mol Cell Biol. 2009. PMID: 19273605 Free PMC article.
-
Environment-responsive transcription factors bind subtelomeric elements and regulate gene silencing.Mol Syst Biol. 2011 Jan 4;7:455. doi: 10.1038/msb.2010.110. Mol Syst Biol. 2011. PMID: 21206489 Free PMC article.
-
Feed-forward mechanism of converting biochemical cooperativity to mitotic processes at the kinetochore plate.Proc Natl Acad Sci U S A. 2011 May 17;108(20):8200-5. doi: 10.1073/pnas.1102020108. Epub 2011 Apr 27. Proc Natl Acad Sci U S A. 2011. PMID: 21525413 Free PMC article.
References
-
- Gould, S. J., and D. Valle. 2000. Peroxisome biogenesis disorders: genetics and cell biology. Trends Genet. 16:340–345. - PubMed
-
- Lazarow, P. B., and Y. Fujiki. 1985. Biogenesis of peroxisomes. Annu. Rev. Cell Biol. 1:489–530. - PubMed
-
- Moser, H. W., and A. B. Moser. 1996. Peroxisomal disorders: overview. Ann. N. Y. Acad. Sci. 804:427–441. - PubMed
-
- Platta, H. W., and R. Erdmann. 2007. Peroxisomal dynamics. Trends Cell Biol. 17:474–484. - PubMed
Publication types
MeSH terms
Substances
Grants and funding
LinkOut - more resources
Full Text Sources
Molecular Biology Databases
Research Materials
Miscellaneous
