Lipid bilayer deformation and the free energy of interaction of a Kv channel gating-modifier toxin
- PMID: 18621840
- PMCID: PMC2553134
- DOI: 10.1529/biophysj.108.130971
Lipid bilayer deformation and the free energy of interaction of a Kv channel gating-modifier toxin
Abstract
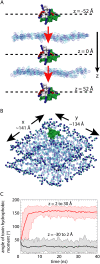
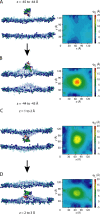
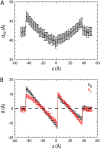
A number of membrane proteins act via binding at the water/lipid bilayer interface. An important example of such proteins is provided by the gating-modifier toxins that act on voltage-gated potassium (Kv) channels. They are thought to partition to the headgroup region of lipid bilayers, and so provide a good system for probing the nature of interactions of a protein with the water/bilayer interface. We used coarse-grained molecular dynamics simulations to compute the one-dimensional potential of mean force (i.e., free energy) profile that governs the interaction between a Kv channel gating-modifier toxin (VSTx1) and model phospholipid bilayers. The reaction coordinate sampled corresponds to the position of the toxin along the bilayer normal. The course-grained representation of the protein and lipids enabled us to explore extended time periods, revealing aspects of toxin/bilayer dynamics and energetics that would be difficult to observe on the timescales currently afforded by atomistic molecular dynamics simulations. In particular, we show for this model system that the bilayer deforms as it interacts with the toxin, and that such deformations perturb the free energy profile. Bilayer deformation therefore adds an additional layer of complexity to be addressed in investigations of membrane/protein systems. In particular, one should allow for local deformations that may arise due to the spatial array of charged and hydrophobic elements of an interfacially located membrane protein.
Figures


Similar articles
-
Interactions between a voltage sensor and a toxin via multiscale simulations.Biophys J. 2010 Apr 21;98(8):1558-65. doi: 10.1016/j.bpj.2009.12.4321. Biophys J. 2010. PMID: 20409475 Free PMC article.
-
Vstx1, a modifier of Kv channel gating, localizes to the interfacial region of lipid bilayers.Biochemistry. 2006 Oct 3;45(39):11844-55. doi: 10.1021/bi061111z. Biochemistry. 2006. PMID: 17002285
-
SGTx1, a Kv channel gating-modifier toxin, binds to the interfacial region of lipid bilayers.Biophys J. 2007 Jan 1;92(1):L07-9. doi: 10.1529/biophysj.106.098681. Epub 2006 Oct 27. Biophys J. 2007. PMID: 17071657 Free PMC article.
-
Gating modifier toxin interactions with ion channels and lipid bilayers: Is the trimolecular complex real?Neuropharmacology. 2017 Dec;127:32-45. doi: 10.1016/j.neuropharm.2017.04.004. Epub 2017 Apr 8. Neuropharmacology. 2017. PMID: 28400258 Review.
-
The interaction of spider gating modifier peptides with voltage-gated potassium channels.Toxicon. 2007 Feb;49(2):285-92. doi: 10.1016/j.toxicon.2006.09.015. Epub 2006 Sep 27. Toxicon. 2007. PMID: 17113615 Review.
Cited by
-
Interactions between a voltage sensor and a toxin via multiscale simulations.Biophys J. 2010 Apr 21;98(8):1558-65. doi: 10.1016/j.bpj.2009.12.4321. Biophys J. 2010. PMID: 20409475 Free PMC article.
-
Effect of gating modifier toxins on membrane thickness: implications for toxin effect on gramicidin and mechanosensitive channels.Toxins (Basel). 2013 Feb 22;5(2):456-71. doi: 10.3390/toxins5020456. Toxins (Basel). 2013. PMID: 23435154 Free PMC article.
-
Molecular dynamics simulations of voltage-gated cation channels: insights on voltage-sensor domain function and modulation.Front Pharmacol. 2012 May 25;3:97. doi: 10.3389/fphar.2012.00097. eCollection 2012. Front Pharmacol. 2012. PMID: 22654756 Free PMC article.
-
The influence of membrane bilayer thickness on KcsA channel activity.Channels (Austin). 2019 Dec;13(1):424-439. doi: 10.1080/19336950.2019.1676367. Channels (Austin). 2019. PMID: 31608774 Free PMC article.
-
The interaction of phospholipase A2 with a phospholipid bilayer: coarse-grained molecular dynamics simulations.Biophys J. 2008 Aug;95(4):1649-57. doi: 10.1529/biophysj.107.123190. Epub 2008 May 9. Biophys J. 2008. PMID: 18469074 Free PMC article.
References
-
- White, S. H., and W. C. Wimley. 1999. Membrane protein folding and stability: physical principles. Annu. Rev. Biophys. Biomol. Struct. 28:319–365. - PubMed
-
- Nina, M., S. Bernèche, and B. Roux. 2000. Anchoring of a monotopic membrane protein: the binding of prostaglandin H2 synthase-1 to the surface of a phospholipid bilayer. Eur. Biophys. J. 29:439–454. - PubMed
-
- Bhardwaj, N., R. V. Stahelin, G. Zhao, W. Cho, and H. Lui. 2007. MeTaDoR: a comprehensive resource for membrane targeting domains and their host proteins. Bioinformatics. 23:3110–3112. - PubMed
Publication types
MeSH terms
Substances
Grants and funding
LinkOut - more resources
Full Text Sources

