. 2008 Sep;148(1):51-60.
doi: 10.1104/pp.108.117358. Epub 2008 Jul 11.

Combination of novel green fluorescent protein mutant TSapphire and DsRed variant mOrange to set up a versatile in planta FRET-FLIM assay

Affiliations

Combination of novel green fluorescent protein mutant TSapphire and DsRed variant mOrange to set up a versatile in planta FRET-FLIM assay

Vincent Bayle et al. Plant Physiol. 2008 Sep.

Abstract

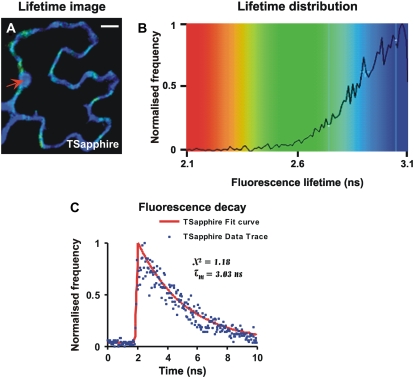
Förster resonance energy transfer (FRET) measurements based on fluorescence lifetime imaging microscopy (FLIM) are increasingly being used to assess molecular conformations and associations in living systems. Reduction in the excited-state lifetime of the donor fluorophore in the presence of an appropriately positioned acceptor is taken as strong evidence of FRET. Traditionally, cyan fluorescent protein has been widely used as a donor fluorophore in FRET experiments. However, given its photolabile nature, low quantum yield, and multiexponential lifetime, cyan fluorescent protein is far from an ideal donor in FRET imaging. Here, we report the application and use of the TSapphire mutant of green fluorescent protein as an efficient donor to mOrange in FLIM-based FRET imaging in intact plant cells. Using time-correlated single photon counting-FLIM, we show that TSapphire expressed in living plant cells decays with lifetime of 2.93 +/- 0.09 ns. Chimerically linked TSapphire and mOrange (with 16-amino acid linker in between) exhibit substantial energy transfer based on the reduction in the lifetime of TSapphire in the presence of the acceptor mOrange. Experiments performed with various genetically and/or biochemically known interacting plant proteins demonstrate the versatility of the FRET-FLIM system presented here in different subcellular compartments tested (cytosol, nucleus, and at plasma membrane). The better spectral overlap with red monomers, higher photostability, and monoexponential lifetime of TSapphire makes it an ideal FRET-FLIM donor to study protein-protein interactions in diverse eukaryotic systems overcoming, in particular, many technical challenges encountered (like autofluorescence of cell walls and fluorescence of pigments associated with photosynthetic apparatus) while studying plant protein dynamics and interactions.


Figures

Figure 1.
Figure 1.
Coexpression of TSapphire and mOrange or chimeric TSapphire-mOrange in intact plant cells. A to C, Confocal images of a representative N. benthamiana leaf epidermal cell coexpressing TSapphire and mOrange. D to F, Confocal image of a representative N. benthamiana cell expressing the chimeric TSapphire-mOrange protein. A and D, TSapphire in green. B and E, mOrange in red. C and F, Overlay images of A and B and D and E, respectively. Scale bars = 45 μm. G, Emission spectra of the TSapphire and mOrange fluorophores expressed in N. benthamiana cells. Also shown is the emission spectrum of chlorophyll autofluorescence. Fluorescence emission spectra were recorded in a λ-spectral mode from 450 to 590 nm for TSapphire; 540 to 660 nm for mOrange; and 600 to 720 nm for chlorophyll using a Leica LCS SP2 CLSM.
Figure 2.
Figure 2.
Excited-state lifetime analysis of TSapphire expressed in N. benthamiana cells. A, Time-correlated single photon fluorescence lifetime image of TSapphire. Scale bar = 25 μm. B, Overall lifetime profile of all the pixels in A. The false color code in A and B depicts the lifetime window from 2.1 ns (red) to 3.1 ns (blue). C, Unfitted data trace, single exponential fitted fluorescence decay curve, χ2 fit, and lifetime (Tm) of a selected region (red arrowhead) in A.
Figure 3.
Figure 3.
TSapphire + mOrange and TSapphire-mOrange FRET-FLIM in intact plant cells. A and C, Lifetime images of TSapphire in a cell coexpressing either TSapphire and mOrange (A) or chimeric TSapphire-mOrange (C). B and D, Overall lifetime profile of all the pixels in A and C, respectively. E, Fitted fluorescence decay curve of a selected region (red arrowhead) in A and C. The false color code in A to D depicts the lifetime of TSapphire from 2.1 ns (red; strong interaction) to 3.1 ns (blue; no interaction). Scale bars = 20 μm.
Figure 4.
Figure 4.
FRET-FLIM analysis on two Arabidopsis cytosolic proteins, SGT1 and RAR1, expressed in N. benthamiana cells. Lifetime image along with overall lifetime distribution profile of TSapphire in a cell expressing SGT1b-TSapphire alone (A and B), SGT1b-TSapphire and RAR1-mOrange (C and D), RAR1-TSapphire alone (F and G), or RAR1-TSapphire and SGT1b-mOrange (H and I). E, Comparison between fitted decay curves of a selected region (red arrowheads) in A and C, whereas J depicts the same for the selected regions in F and H. The false color code in A to I (excluding E) depicts the lifetime of the donor TSapphire from 2.1 ns (red color; strong interaction) to 3.1 (blue color; no interaction). Scale bars = 15 μm, except for F, where it is 45 μm.
Figure 5.
Figure 5.
FRET-FLIM analysis on nuclear-encoded maize transcriptional activator O2 and transcriptional coactivator ADA2. Lifetime image along with overall lifetime distribution profile of TSapphire in the nucleus of representative cells coexpressing TSapphire and mOrange (A and B), O2-Tsapphire (C and D), O2-TSapphire and ADA2-mOrange (E and F), or ADA2-TSapphire and O2-mOrange (G and H). I, Comparison between fitted decay curves of a selected region (red arrowheads) from A and C against a similar region from E and G. The false color code in A to H depicts the lifetime of the donor TSapphire from 2.1 ns (red color; strong interaction) to 3.1 (blue color; no interaction). Scale bars = 5 μm.
Figure 6.
Figure 6.
FRET-FLIM analysis on integral membrane protein MLO and cytosolic barley CaM. Lifetime image along with the overall lifetime distribution profile of representative cells expressing CaM-TSapphire alone (A and B), CaM-TSapphire and MLO-mOrange (C to F), or TSapphire and MLO-mOrange (G and H). I, Comparison between fitted decay curves of a selected region (red arrowheads) in A, C, E, and G. The false color code in A to H depicts the lifetime of the donor from 2.1 ns (red color; strong interaction) to 3.1 (blue color; no interaction). Scale bars = 45 μm for A and B; 15 μm for E and G.

References

    1. Azevedo C, Sadanandom A, Kitagawa K, Freialdenhoven A, Shirasu K, Schulze-Lefert P (2002) The RAR1 interactor SGT1, an essential component of R gene-triggered disease resistance. Science 295 2073–2076 - PubMed
    1. Bastiaens PI, Squire A (1999) Fluorescence lifetime imaging microscopy: spatial resolution of biochemical processes in the cell. Trends Cell Biol 9 48–52 - PubMed
    1. Becker W, Bergmann A, Haustein E, Petrasek Z, Schwille P, Biskup C, Kelbauskas L, Benndorf K, Klocker N, Anhut T, et al (2006) Fluorescence lifetime images and correlation spectra obtained by multidimensional time-correlated single photon counting. Microsc Res Tech 69 186–195 - PubMed
    1. Becker W, Bergmann A, Hink MA, Konig K, Benndorf K, Biskup C (2004) Fluorescence lifetime imaging by time-correlated single-photon counting. Microsc Res Tech 63 58–66 - PubMed
    1. Bhat RA, Borst JW, Riehl M, Thompson RD (2004) Interaction of maize Opaque-2 and the transcriptional co-activators GCN5 and ADA2, in the modulation of transcriptional activity. Plant Mol Biol 55 239–252 - PubMed

Publication types

MeSH terms

LinkOut - more resources