

Integration of cytogenetic and genetic linkage maps unveils the physical architecture of tomato chromosome 2
- PMID: 18622034
- PMCID: PMC2475727
- DOI: 10.1534/genetics.108.089532
Integration of cytogenetic and genetic linkage maps unveils the physical architecture of tomato chromosome 2
Abstract
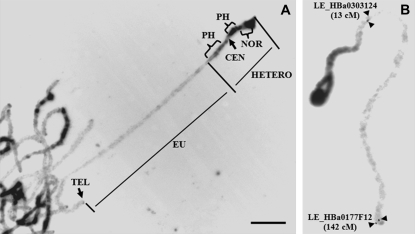
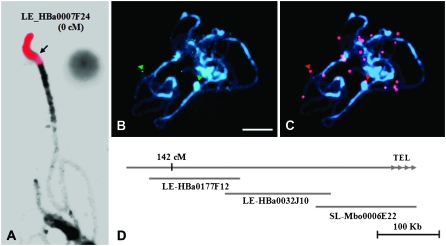
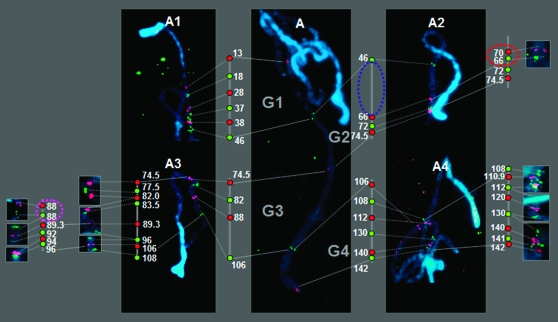
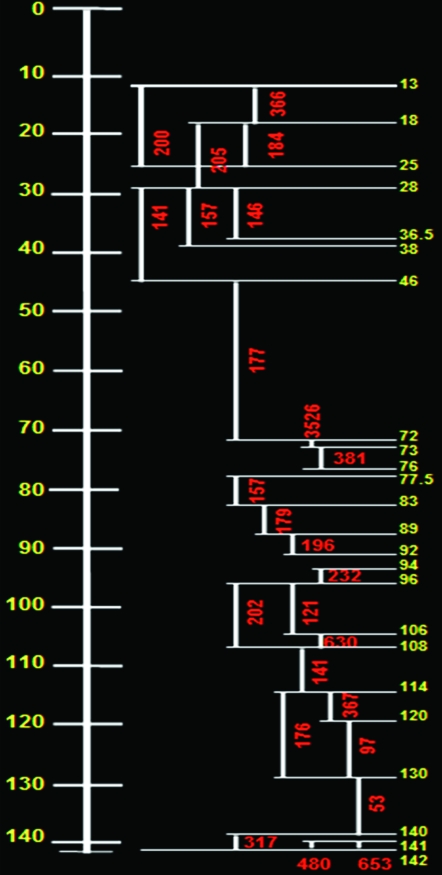
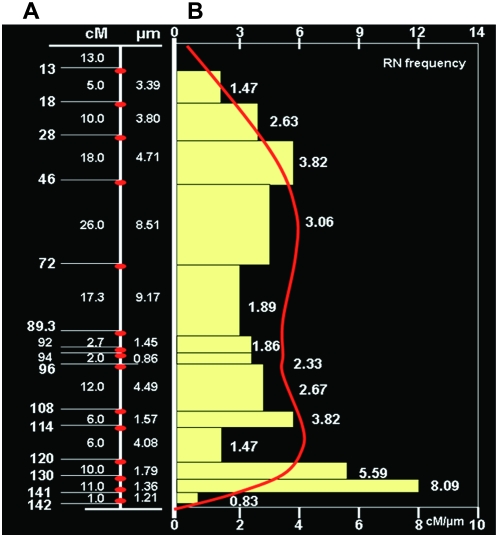
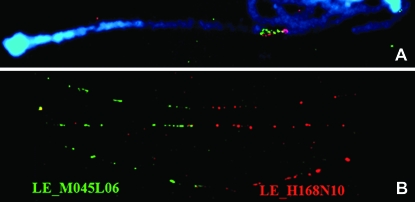
We report the integration of the linkage map of tomato chromosome 2 with a high-density bacterial artificial chromosome fluorescence in situ hybridization (BAC-FISH)-based cytogenetic map. The euchromatic block of chromosome 2 resides between 13 and 142 cM and has a physical length of 48.12 microm, with 1 microm equivalent to 540 kb. BAC-FISH resolved a pair of loci that were 3.7-3.9 Mb apart and were not resolved on the linkage map. Most of the regions had crossover densities close to the mean of approximately 200 kb/cM. Relatively hot and cold spots of recombination were unevenly distributed along the chromosome. The distribution of centimorgan/micrometer values was similar to the previously reported recombination nodule distribution along the pachytene chromosome. FISH-based physical maps will play an important role in advanced genomics research for tomato, including map-based cloning of agronomically important traits and whole-genome sequencing.
Figures
Similar articles
-
Chromatin structure and physical mapping of chromosome 6 of potato and comparative analyses with tomato.Genetics. 2008 Nov;180(3):1307-17. doi: 10.1534/genetics.108.093179. Epub 2008 Sep 14. Genetics. 2008. PMID: 18791232 Free PMC article.
-
Solanum lycopersicum cv. Heinz 1706 chromosome 6: distribution and abundance of genes and retrotransposable elements.Plant J. 2009 Jun;58(5):857-69. doi: 10.1111/j.1365-313X.2009.03822.x. Epub 2009 Feb 4. Plant J. 2009. PMID: 19207213
-
High-resolution chromosome mapping of BACs using multi-colour FISH and pooled-BAC FISH as a backbone for sequencing tomato chromosome 6.Plant J. 2008 Nov;56(4):627-37. doi: 10.1111/j.1365-313X.2008.03626.x. Epub 2008 Sep 18. Plant J. 2008. PMID: 18643986
-
Role of fluorescence in situ hybridization in sequencing the tomato genome.Cytogenet Genome Res. 2009;124(3-4):339-50. doi: 10.1159/000218137. Epub 2009 Jun 25. Cytogenet Genome Res. 2009. PMID: 19556785 Review.
-
[Cytogenetic maps and their applications in plants].Yi Chuan. 2005 Jul;27(4):659-64. Yi Chuan. 2005. PMID: 16120595 Review. Chinese.
Cited by
-
The megabase-scale crossover landscape is largely independent of sequence divergence.Nat Commun. 2022 Jul 2;13(1):3828. doi: 10.1038/s41467-022-31509-8. Nat Commun. 2022. PMID: 35780220 Free PMC article.
-
Comparative analysis of pepper and tomato reveals euchromatin expansion of pepper genome caused by differential accumulation of Ty3/Gypsy-like elements.BMC Genomics. 2011 Jan 29;12:85. doi: 10.1186/1471-2164-12-85. BMC Genomics. 2011. PMID: 21276256 Free PMC article.
-
Assignment of genetic linkage maps to diploid Solanum tuberosum pachytene chromosomes by BAC-FISH technology.Chromosome Res. 2009;17(7):899-915. doi: 10.1007/s10577-009-9077-3. Epub 2009 Sep 23. Chromosome Res. 2009. PMID: 19774472 Free PMC article.
-
Cytogenetic maps of homoeologous chromosomes A h01 and D h01 and their integration with the genome assembly in Gossypium hirsutum.Comp Cytogenet. 2017 Jun 19;11(2):405-420. doi: 10.3897/CompCytogen.v11i2.12824. eCollection 2017. Comp Cytogenet. 2017. PMID: 28919972 Free PMC article.
-
Construction of cytogenetic map of Gossypium herbaceum chromosome 1 and its integration with genetic maps.Mol Cytogenet. 2015 Jan 22;8(1):2. doi: 10.1186/s13039-015-0106-y. eCollection 2015. Mol Cytogenet. 2015. PMID: 25628758 Free PMC article.
References
-
- Anderson, L. K., and S. M. Stack, 2005. Recombination nodules in plants. Cytogenet. Genome Res. 109 198–204. - PubMed
-
- Arumuganathan, K., and E. D. Earle, 1991. Nuclear DNA content of some important plant species. Plant Mol. Biol. Rep. 9 208–218.
-
- Bennett, M. D., and J. B. Smith, 1976. Nuclear DNA amounts in angiosperms. Philos. Trans. R. Soc. Lond. B Biol. Sci. 274 227–274. - PubMed
Publication types
MeSH terms
Substances
LinkOut - more resources
Full Text Sources
Other Literature Sources
Miscellaneous
