

Dissection of the genetic architecture of body weight in chicken reveals the impact of epistasis on domestication traits
- PMID: 18622035
- PMCID: PMC2475757
- DOI: 10.1534/genetics.108.089300
Dissection of the genetic architecture of body weight in chicken reveals the impact of epistasis on domestication traits
Abstract
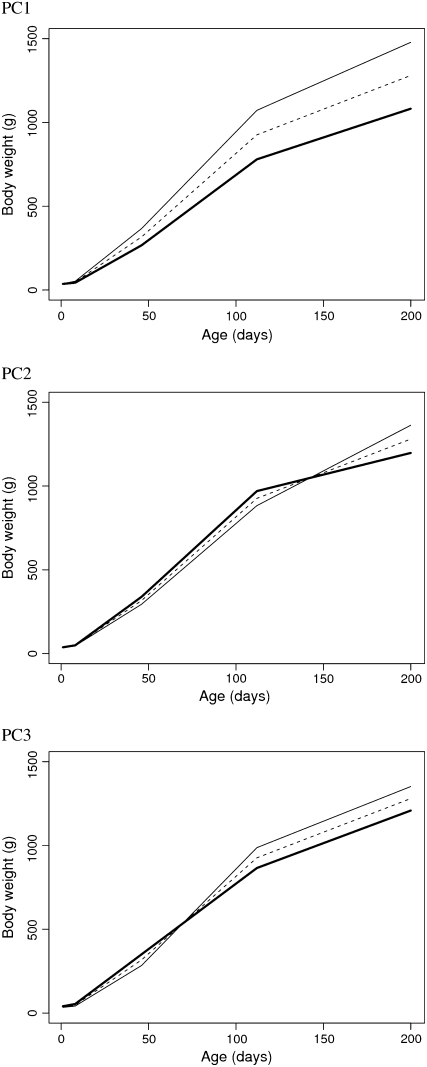
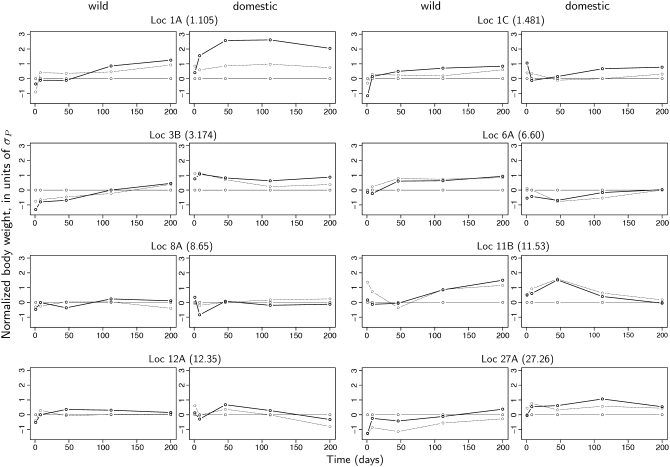
In this contribution, we study the genetic mechanisms leading to differences in the observed growth patterns of domesticated White Leghorn chickens and their wild ancestor the red jungle fowl. An epistatic QTL analysis for several body-weight measures from hatch to adulthood confirms earlier findings that polymorphisms at >15 loci contribute to body-weight determination in an F(2) intercross between these populations and that many loci are involved in complex genetic interactions. Here, we use a new genetic model to decompose the genetic effects of this multilocus epistatic genetic network. The results show how the functional modeling of genetic effects provides new insights into how genetic interactions in a large set of loci jointly contribute to phenotypic expression. By exploring the functional effects of QTL alleles, we show that some alleles can display temporal shifts in the expression of genetic effects due to their dependencies on the genetic background. Our results demonstrate that the effects of many genes are dependent on genetic interactions with other loci and how their involvement in the domestication process relies on these interactions.
Figures
Similar articles
-
A global search reveals epistatic interaction between QTL for early growth in the chicken.Genome Res. 2003 Mar;13(3):413-21. doi: 10.1101/gr.528003. Genome Res. 2003. PMID: 12618372 Free PMC article.
-
A longitudinal quantitative trait locus mapping of chicken growth traits.Mol Genet Genomics. 2019 Feb;294(1):243-252. doi: 10.1007/s00438-018-1501-y. Epub 2018 Oct 12. Mol Genet Genomics. 2019. PMID: 30315370
-
Replication and explorations of high-order epistasis using a large advanced intercross line pedigree.PLoS Genet. 2011 Jul;7(7):e1002180. doi: 10.1371/journal.pgen.1002180. Epub 2011 Jul 21. PLoS Genet. 2011. PMID: 21814519 Free PMC article.
-
New Horizons for Dissecting Epistasis in Crop Quantitative Trait Variation.Annu Rev Genet. 2020 Nov 23;54:287-307. doi: 10.1146/annurev-genet-050720-122916. Epub 2020 Sep 1. Annu Rev Genet. 2020. PMID: 32870731 Review.
-
Review of quantitative trait loci identified in the chicken.Poult Sci. 2006 Dec;85(12):2079-96. doi: 10.1093/ps/85.12.2079. Poult Sci. 2006. PMID: 17135661 Review.
Cited by
-
Effect of regulatory architecture on broad versus narrow sense heritability.PLoS Comput Biol. 2013;9(5):e1003053. doi: 10.1371/journal.pcbi.1003053. Epub 2013 May 9. PLoS Comput Biol. 2013. PMID: 23671414 Free PMC article.
-
Estimation of genetic effects and genotype-phenotype maps.Evol Bioinform Online. 2008 Jun 28;4:225-35. doi: 10.4137/ebo.s756. Evol Bioinform Online. 2008. PMID: 19204820 Free PMC article.
-
Genome-wide association study identified a narrow chromosome 1 region associated with chicken growth traits.PLoS One. 2012;7(2):e30910. doi: 10.1371/journal.pone.0030910. Epub 2012 Feb 16. PLoS One. 2012. PMID: 22359555 Free PMC article.
-
Maladaptation in feral and domesticated animals.Evol Appl. 2019 Mar 18;12(7):1274-1286. doi: 10.1111/eva.12784. eCollection 2019 Aug. Evol Appl. 2019. PMID: 31417614 Free PMC article. Review.
-
MIDESP: Mutual Information-Based Detection of Epistatic SNP Pairs for Qualitative and Quantitative Phenotypes.Biology (Basel). 2021 Sep 16;10(9):921. doi: 10.3390/biology10090921. Biology (Basel). 2021. PMID: 34571798 Free PMC article.
References
-
- Andersson, L., C. S. Haley, H. Ellegren, S. A. Knott, M. Johansson et al., 1994. Genetic mapping of quantitative trait loci for growth and fatness in pigs. Science 263 1771–1774. - PubMed
-
- Barton, N. H., and M. Turelli, 2004. Effects of genetic drift on variance components under a general model of epistasis. Evolution 58 2111–2132. - PubMed
-
- Carlborg, Ö., and L. Andersson, 2002. The use of randomization testing for detection of multiple epistatic QTL. Genet. Res. 79 175–184. - PubMed
Publication types
MeSH terms
LinkOut - more resources
Full Text Sources
Medical
Miscellaneous
