. 2008 Jul;179(3):1601-55.
doi: 10.1534/genetics.107.086074. Epub 2008 Jul 13.

Polytene chromosomal maps of 11 Drosophila species: the order of genomic scaffolds inferred from genetic and physical maps

Affiliations

Polytene chromosomal maps of 11 Drosophila species: the order of genomic scaffolds inferred from genetic and physical maps

Stephen W Schaeffer et al. Genetics. 2008 Jul.

Abstract

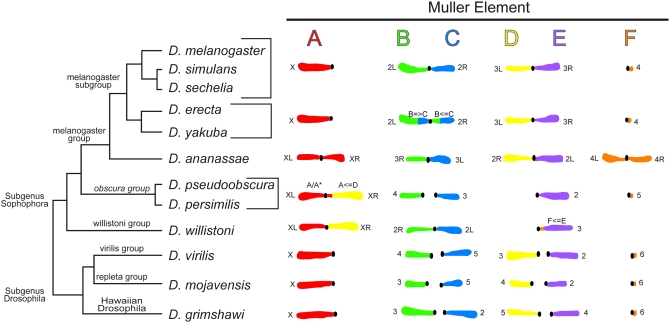
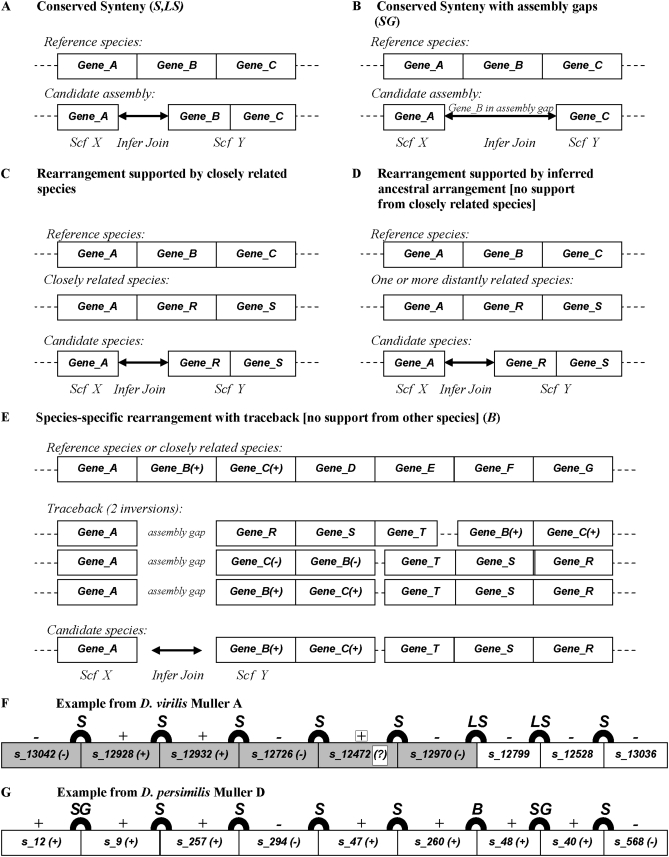
The sequencing of the 12 genomes of members of the genus Drosophila was taken as an opportunity to reevaluate the genetic and physical maps for 11 of the species, in part to aid in the mapping of assembled scaffolds. Here, we present an overview of the importance of cytogenetic maps to Drosophila biology and to the concepts of chromosomal evolution. Physical and genetic markers were used to anchor the genome assembly scaffolds to the polytene chromosomal maps for each species. In addition, a computational approach was used to anchor smaller scaffolds on the basis of the analysis of syntenic blocks. We present the chromosomal map data from each of the 11 sequenced non-Drosophila melanogaster species as a series of sections. Each section reviews the history of the polytene chromosome maps for each species, presents the new polytene chromosome maps, and anchors the genomic scaffolds to the cytological maps using genetic and physical markers. The mapping data agree with Muller's idea that the majority of Drosophila genes are syntenic. Despite the conservation of genes within homologous chromosome arms across species, the karyotypes of these species have changed through the fusion of chromosomal arms followed by subsequent rearrangement events.


Figures

F<sc>igure</sc> 1.—
Figure 1.—
Karyotypic and syntenic relationships of the 12 sequenced species of the genus Drosophila. (Left) The phylogenetic relationships of the 12 species. The members of the two main subgenera, Drosophila and Sophophora, are distinguished by the configuration of their autosomes. The ancestral pattern is shown by the subgenus Drosophila, which has all acrocentric chromosomes. The members of the subgenus Sophophora differ from this pattern in having varying numbers of fusions of these elements. (Right) The chromosomal arms are separated and aligned as Muller syntenic elements. Each element is differently colored and the arms are also designated by their conventional numbering. There is not a simple one-to-one correspondence for all of the species chromosome arms and a single Muller element. This lack of correspondence is associated with identified fusion and/or inversion events that reassociate all or portions of arms/elements in six of the species relative to D. melanogaster. The black dots designate the positions of the centromeres.
F<sc>igure</sc> 2.—
Figure 2.—
Computational support for anchoring scaffolds. (A) Scaffold joins inferred using conserved synteny. Joins supported by conserved synteny (S) and localized gene scrambling with conserved synteny for the larger context (LS, not shown) are included here. Boxes represent adjacent genes (in order on a chromosome in the reference species or on one or more scaffolds in a candidate assembly). (B) Scaffold joins inferred using conserved synteny and intervening assembly gaps (SG). Gene_B is inferred, by Synpipe, to lie in an assembly gap in the candidate genome assembly. (C) Scaffold joins inferred using rearrangements supported by closely related species. The reference species is not informative in this case. Closely related species inform the joining process if they do not have a scaffold break in their assembly around the same position. This scenario could also be complicated by intermediate markers missing due to an unsequenced assembly gap. (D) Scaffold joins inferred using rearrangements supported by an inferred ancestral arrangement. In such cases, there is no support from closely related species or the reference species. One or more distantly related species allow inference of a conserved ancestral arrangement (especially when they flank the ancestral node in a given phylogeny). In such cases, there is no support from closely related species or the reference species. Such joins are considered to be of lower confidence compared to earlier cases. (E) Scaffold joins inferred using species-specific rearrangement with trace-back (B). In such cases, there is lack of direct support from any species in the phylogeny. Through a series of inversions (two in this case), the gene order of a candidate genome assembly, with an assumed scaffold join, could match that of a reference species (or closely related species). Such a scaffold join can then be inferred and the gene order could be interpreted as the result of a species-specific rearrangement. (F and G) Boxes denote scaffolds anchored on a chromosome with relative order and orientation. Scaffolds are identified with their CAF1 scaffold identifiers (Drosophila 12 Genomes Consortium 2007). Shaded boxes highlight scaffolds that have experimental support for their placement and orientation (on the basis of the in situ localization of markers). Arcs connecting two scaffolds show that these scaffold joins were supported by predictions based on analysis of synteny and rearrangement data. Each arc is identified by abbreviations (S, LS, SG, B) identified earlier. Scaffold orientation predicted by synteny analysis is listed above each scaffold. Scaffolds are not drawn to scale. (F) D. virilis Muller element A inference. Synteny-based predictions supplement experimental data by helping orient scaffold s_12472 for which there was a single marker. There is complete agreement between these predictions and experimental analysis. Predictions are based on conserved synteny (S) with localized scrambling at the edges of scaffolds in two cases (LS). The three unshaded scaffolds to the right (s_12799–s_13036) are placed using computational support. These are likely in the pericentromeric heterochromatin. Consistent with this hypothesis, each contains between 35 and 45% of transposable element content in contrast with 3–5% for similarly sized euchromatin scaffolds (B. McAllister, personal communication). (G) D. persimilis Muller element D inference. A short fragment of this chromosome is shown here (a total of 46 joins are predicted for this arm). Synpipe analysis provided the primary evidence for inferring scaffold joins for this fragmented assembly. These predictions illustrate joins based on various criteria, including species-specific breakpoints (B) at the edges of scaffolds and assembly gaps between scaffolds (SG). These predictions agree with the gene order established using the extensive set of known experimental markers in D. pseudoobscura (the closest available genome to D. persimilis).
F<sc>igure</sc> 3.—
Figure 3.—
Alignments of the D. simulans sequence scaffolds with the polytene chromosome maps of D. melanogaster. A single major scaffold covers each of the chromosome arms. A listing of all of the identified orthologs, their coordinates in the scaffolds, and their cytological ordering can be seen in supplemental Table 16 along with the smaller scaffolds that were not aligned with the chromosomes. With one exception, the scaffolds align well with the chromosomes and extend for essentially the entire length of each arm. The primary exception to this is seen in Muller element C (2R) where a segment of element D (3L) (solid area) is inserted into the C (2R) scaffold. We interpret this insertion as a mis-assembly of the scaffold. As a check on the alignment, several genes that were previously localized by in situ hybridization in D. simulans and reported in FlyBase were identified in the list of orthology calls. These genes are listed in the tables above the chromosome maps and their location in the scaffolds and chromosomes is indicated by a line. Both the called cytology and that predicted by the position of their D. melanogaster orthologs are also given in the table. At the top of the table are the starting and ending coordinates in the CAF1 assemblies for the gene listed below. In Muller element E (3R), there is a well-documented paracentric inversion that distinguishes this arm from that of D. melanogaster. The inversion is clearly evident in the E (3R) scaffold with breakpoints at 84F9 and 93F6-7. This molecular reordering is nicely consistent with the observed cytology in D. melanogaster/D. simulans hybrids. There is, however, no evidence for a set of small inversions reported at the telomeric end of A (X), the base of C (2R), and the base of E (3R). The ideograms are from the drawings by Bridges (1935, Figure 3) and are reproduced with kind permission from the American Genetics Association and Oxford University Press. The photographic maps are from Lefevre (1976, Figures 21–23).
F<sc>igure</sc> 4.—
Figure 4.—
Alignments of the D. sechellia sequence scaffolds with the polytene chromosome maps of D. melanogaster. D. sechellia was sequenced to only three to four times coverage and thus its assembled scaffolds are more numerous. The number of aligned scaffolds for each Muller element are A (X), 21; B (2L), 10; C (2R), 6; D (3L), 7; and E (3R), 15. The lower coverage in this species has also apparently resulted in assembly errors in that there are four scaffolds (0, 3, 4, and 5) that are derived from noncontiguous sequences, which in some cases derive from different Muller elements. Scaffold 0 is a chimera of D (3L) and E (3R); scaffold 3 joins noncontiguous sequences of B (2L); scaffold 4 is a chimera of A (X) and E (3R) and scaffold 5 joins noncontiguous sequences of B (2L) and is a chimera of B (2L), C (2R), and F (3R). The relative position of all of these mis-associations is shaded in the tables. The lines that connect the tables above the chromosome maps indicate the extent of each scaffold and the lines from the solid boxes down to the chromosome ideogram indicate the cytological limits of each scaffold. Each table shows the first and last D. melanogaster ortholog identified, the inferred cytological limits, and the beginning and ending molecular coordinates in the CAF1 assemblies for each scaffold. As in D. simulans, the known inversion in E (3R) is readily evident in the molecular map. The proximal breakpoint at 84E9 is found in scaffold 6 and the distal break in 93F6,7 is in that portion of scaffold 0 that aligns with the portion of E (3R). The breakpoints seen here are identical to those seen in D. simulans. As is the case for D. simulans, we can find no evidence for the small inversions in the tip of A (X) or in the bases of C (2R) and E (3R). All of the identified orthologs, their coordinates, and cytological order in D. melanogaster are shown in supplemental Table 17 with a listing of small, unaligned scaffolds. The ideograms are from the drawings by Bridges (1935, Figure 3) and are reproduced with kind permission from the American Genetics Association and Oxford University Press. The photographic maps are from Lefevre (1976, Figures 21–23).
F<sc>igure</sc> 5.—
Figure 5.—
Alignments of the D. erecta sequence scaffolds with the polytene chromosome maps of D. melanogaster. The coverage of D. erecta was 12× and the assembly of the scaffolds, thus, quite good. There are two major scaffolds aligned to the A (X) and E (3R) while each remaining element is represented by single scaffolds that extend for essentially the entire length of each arm. The exception to this is scaffold 4770 in E (3R) where there is an apparent gap in the sequence that is indicated by a shaded bar in the table above the chromosome map. The genome of D. erecta differs from that of D. melanogaster in that there are several paracentric inversions in each of the Muller elements as well as a pericentric inversion between the B (2L) and C (2R) arms. In the A (X) element, there are six inversion breakpoints (three inversions) evident in the molecular map. The solid bars in the tables above the chromosome maps indicate the positions of these. The brackets above the chromosomes show the extent of the overlapping inversions. A similar designation is provided in the tables above the remaining elements. In B·C (2LR), there are seven detected breaks: C/B (2RL), 5; D (3L), 7; E (3R), 4; and F (4), 0. The tables also show the predicted molecular cytology of the breakpoints derived from the alignment of the D. melanogaster orthologs in the scaffolds. Below those values in each table are shown the observed cytological breakpoints derived from a comparison of the polytene banding patterns of D. erecta and D. melanogaster chromosomes. The observed and molecular assignments are in most cases in excellent agreement. Exceptions to this are indicated by shading in the tables. In all exceptional cases, the lack of correspondence is associated with very small cytological intervals that would have been difficult, if not impossible, to detect at the resolution provided by squash preparations. The larger of the two inversions in E (3R) appears to be identical to the inversion in the same element in D. simulans and D. sechellia. A listing of all of the identified orthologs, their coordinates in the scaffolds, and their cytological ordering can be seen in supplemental Table 18 along with the smaller scaffolds that were not aligned to the chromosomes. The ideograms are from the drawings by Bridges (1935, Figure 3) and are reproduced with kind permission from the American Genetics Association and Oxford University Press. The photographic maps are from Lefevre (1976, Figures 21–23).
F<sc>igure</sc> 6.—
Figure 6.—
Alignments of the D. yakuba sequence scaffolds with the polytene chromosome maps of D. melanogaster. Similar to D. erecta, the coverage of D. yakuba was high (12 times) and there are several large scaffolds that cover each of the Muller element arms essentially entirely. At the resolution of the alignment technique used here there are no large gaps or apparent mis-assemblies. The solid bars in the tables indicated the positions of the breakpoints found in the molecular maps of the various Muller elements. On A (X), there are 12 breaks; B·C (2LR), 9; C·B (2RL), 13; D (3L), 9; E (3R), 13; and F (4), 0. The brackets above each of the arms indicate the extent of the para- and pericentric inversions associated with these breaks. Again, imbedded within the group of inversions seen in the E (3R) element are breakpoints identical to those associated with the large inversion in D. simulans, D. sechellia, and D. erecta. There are significantly more breaks in D. yakuba than in any of the other species in the melanogaster subgroup investigated and thus there is significantly more chromosomal rearrangement in this species relative to D. melanogaster as compared to the other three species. It is this fact that underlies the less robust agreement between the molecular and observed cytology. As in Figure 3, shading indicates a detected rearranged segment in the molecular alignment that was not seen in a comparison of the polytene banding patterns of D. melanogaster and D. yakuba. Again, most of these are associated with small molecular and cytological segments that would have been difficult to discern cytologically. A listing of all of the identified orthologs, their coordinates in the scaffolds, and their cytological ordering is in supplemental Table 19 along with the smaller scaffolds that were not aligned to the chromosomes. The ideograms are from the drawings by Bridges (1935, Figure 3) and are reproduced with kind permission from the American Genetics Association and Oxford University Press. The photographic maps are from Lefevre (1976, Figures 21–23).
F<sc>igure</sc> 7.—
Figure 7.—
Alignments of the D. ananassae sequence scaffolds with the polytene chromosome maps (Tobari et al. 1993). For each chromosome arm, the three maps are the genetic map, the scaffold map showing markers on the genetic and chromosome maps, and the salivary chromosome map with the section and subsection designations. The ideograms and chromosomes from Tobari et al. (1993, Figures 15 and 16) were reproduced with kind permission of the Japan Scientific Societies Press.
F<sc>igure</sc> 8.—
Figure 8.—
Alignments of the D. pseudoobscura sequence scaffolds with the polytene chromosome maps. For each chromosome, the four maps are the genetic map, the scaffold map showing markers on the genetic and chromosomal maps, the ideogram of the chromosome showing section and subsection designations, and the salivary chromosome map with the section and subsection designations. “CL” drawn across a scaffold junction indicates that the join is supported by conserved linkage information in at least one other species. Supplemental Table 15 provides the annotation for the numbered scaffolds. The ideograms were reproduced based on the images by Dobzhansky and Tan (1936, Plate 1) and Tan (1937, Plate 1) with kind permission of Springer Science and Business Media.
F<sc>igure</sc> 9.—
Figure 9.—
Alignments of the D. persimilis sequence scaffolds with the polytene chromosome maps. For each chromosome, the four maps are the genetic map, the scaffold map showing markers on the genetic and chromosomal maps, the ideogram of the chromosome showing section and subsection designations, and the salivary chromosome map with the section and subsection designations. “CL” drawn across a scaffold junction indicates that the join is supported by conserved linkage information in at least one other species. Supplemental Table 15 provides the annotation for the numbered scaffolds. The ideograms were reproduced based on the images by Dobzhansky and Tan (1936, Plate 1) and Tan (1937, Plate 1) with kind permission of Springer Science and Business Media.
F<sc>igure</sc> 10.—
Figure 10.—
Alignments of the D. willistoni sequence scaffolds with the polytene chromosome maps. For each chromosome, the four maps are the genetic map, the scaffold map showing markers on the genetic and chromosomal maps, the ideogram of the chromosome showing section designations from the salivary chromosomes reference map of Dobzhansky (1950), and the salivary chromosome map with the section and subsection designations and with the photomap of Rohde (2000). “CL” drawn across a scaffold junction indicates that the join is supported by conserved linkage information in at least one other species. Supplemental Table 15 provides the annotation for the numbered scaffolds. The ideograms from Dobzhansky (1950, Figure 9) were reproduced with kind permission of Oxford University Press.
F<sc>igure</sc> 11.—
Figure 11.—
Alignments of the D. virilis sequence scaffolds with the polytene chromosome maps of D. virilis. Scaffolds derived from the whole-genome assembly are indicated as blocks positioned on the basis of in situ localization (below) and linkage relationships (above) of markers, which serve as anchor points for the sequence. Comparative genomic analyses also oriented the scaffolds on the basis of conserved linkage relationships. Each scaffold is identified by a unique element ID corresponding to information in supplemental Table 15. Darker shading of a scaffold indicates agreement between the physical and comparative genomic approaches, whereas lighter shading of a scaffold indicates that the orientation is based solely on conserved linkage or solely on marker data. Adjacency of scaffolds represents conserved linkage blocks. Chromosomal positions of terminal markers in each scaffold are indicated and labeled with their identity. Shading represents regions with additional anchor positions within the scaffold with only a subset indicated. Gene symbols are based on existing nomenclature for D. virilis with the corresponding gene symbol for D. melanogaster in parentheses. Each anchor position is included as supplemental Table 24. The ideograms are from the drawings by Kress (1993, Figure 1) and the photographic maps are from (Gubenko and Evgen'ev (1984, Figure 2); both are reproduced with permission from Springer Science Business and Media.
F<sc>igure</sc> 12.—
Figure 12.—
Alignments of the D. mojavensis sequence scaffolds with the polytene chromosome maps of D. mojavensis. Organization of assembled genome sequence on polytene chromosomes of D. mojavensis. Scaffolds derived from the whole-genome assembly are indicated as blocks positioned on the basis of in situ localization (below) and linkage relationships (above) of markers (recombination units shown), which serve as anchor points for the sequence. With the exception of linkage locus A3-10-13, all linkage loci were found in the assembly. Comparative genomic analyses also oriented the scaffolds on the basis of conserved linkage relationships. Each scaffold is identified by a unique element ID with GenBank accession number, direction (+ or − relative to telomere and a “?” if direction is unknown), scaffold ID, and overall size (in megabases) indicated. Shading of a scaffold indicates agreement between the physical and comparative genomic approaches and open areas of a scaffold indicate that the orientation is based solely on conserved linkage. Adjacent scaffolds represent conserved linkage blocks. Chromosomal positions of terminal markers in each scaffold are indicated and labeled by their probe name, and the corresponding gene symbols (based on the nomenclature for D. melanogaster) are shown below in parentheses.
F<sc>igure</sc> 13.—
Figure 13.—
Alignments of the D. grimshawi sequence scaffolds with the polytene chromosome maps of D. grimshawi. For each chromosome, the two maps are the scaffold map showing markers on the genetic and chromosomal maps and the salivary chromosome map with the section and subsection designations. The photographic map is from Carson et al. (1992, Figures 1–5) and is reproduced with kind permission of CRC Press.

Similar articles

Cited by

References

    1. Aguadé, M., N. Miyashita and C. H. Langley, 1989. Reduced variation in the yellow-achaete-scute region in natural populations of Drosophila melanogaster. Genetics 122 607–615. - PMC - PubMed
    1. Altschul, S. F., T. L. Madden, A. A. Schaffer, J. Zhang, Z. Zhang et al., 1997. Gapped BLAST and PSI-BLAST: a new generation of protein database search programs. Nucleic Acids Res. 25 3389–3402. - PMC - PubMed
    1. Anderson, W. W., F. J. Ayala and R. E. Michod, 1977. Chromosomal and allozymic diagnosis of three species of Drosophila, Drosophila pseudoobscura, Drosophila persimilis, and Drosophila miranda. J. Hered. 68 71–74. - PubMed
    1. Anderson, W. W., J. Arnold, D. G. Baldwin, A. T. Beckenbach, C. J. Brown et al., 1991. Four decades of inversion polymorphism in Drosophila pseudoobscura. Proc. Natl. Acad. Sci. USA 88 10367–10371. - PMC - PubMed
    1. Ashburner, M., and F. Lemeunier, 1976. Relationships within the melanogaster species subgroup of the genus Drosophila (Sophophora). I. Inversion polymorphisms in Drosophila melanogaster and Drosophila simulans. Proc. R. Soc. Lond. B Biol. Sci. 193 137–157. - PubMed

Publication types

Substances

LinkOut - more resources