

Linkage disequilibrium and persistence of phase in Holstein-Friesian, Jersey and Angus cattle
- PMID: 18622038
- PMCID: PMC2475750
- DOI: 10.1534/genetics.107.084301
Linkage disequilibrium and persistence of phase in Holstein-Friesian, Jersey and Angus cattle
Abstract
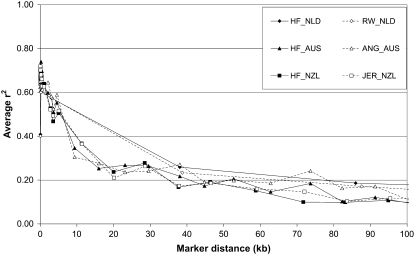
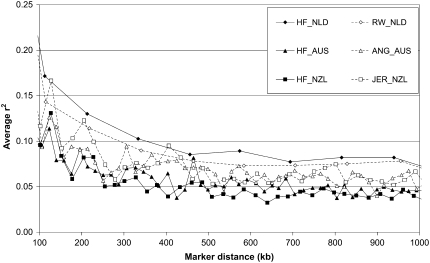
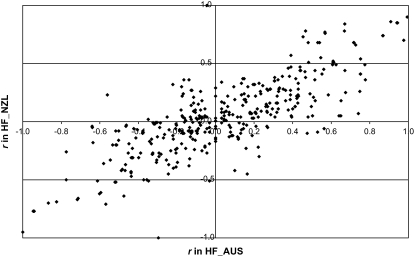
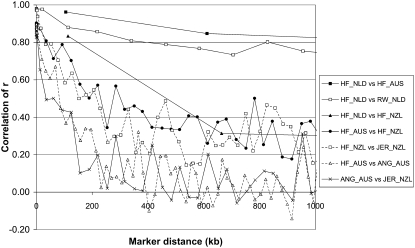
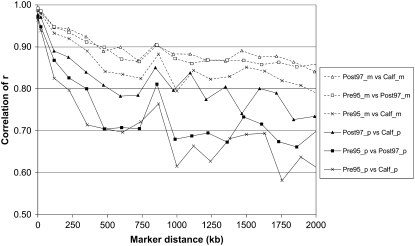
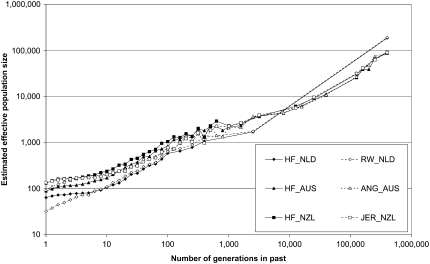
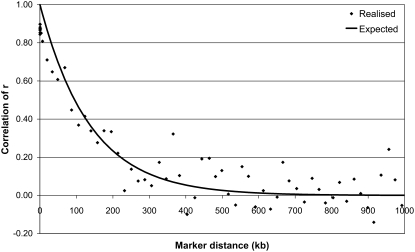
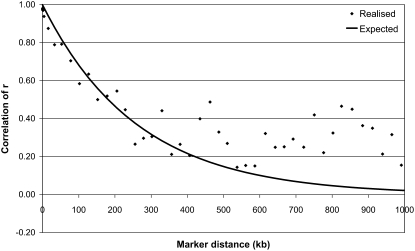
When a genetic marker and a quantitative trait locus (QTL) are in linkage disequilibrium (LD) in one population, they may not be in LD in another population or their LD phase may be reversed. The objectives of this study were to compare the extent of LD and the persistence of LD phase across multiple cattle populations. LD measures r and r(2) were calculated for syntenic marker pairs using genomewide single-nucleotide polymorphisms (SNP) that were genotyped in Dutch and Australian Holstein-Friesian (HF) bulls, Australian Angus cattle, and New Zealand Friesian and Jersey cows. Average r(2) was approximately 0.35, 0.25, 0.22, 0.14, and 0.06 at marker distances 10, 20, 40, 100, and 1000 kb, respectively, which indicates that genomic selection within cattle breeds with r(2) >or= 0.20 between adjacent markers would require approximately 50,000 SNPs. The correlation of r values between populations for the same marker pairs was close to 1 for pairs of very close markers (<10 kb) and decreased with increasing marker distance and the extent of divergence between the populations. To find markers that are in LD with QTL across diverged breeds, such as HF, Jersey, and Angus, would require approximately 300,000 markers.
Figures
Similar articles
-
Extent of genome-wide linkage disequilibrium in Australian Holstein-Friesian cattle based on a high-density SNP panel.BMC Genomics. 2008 Apr 24;9:187. doi: 10.1186/1471-2164-9-187. BMC Genomics. 2008. PMID: 18435834 Free PMC article.
-
Linkage disequilibrium, persistence of phase, and effective population size in Spanish local beef cattle breeds assessed through a high-density single nucleotide polymorphism chip.J Anim Sci. 2016 Jul;94(7):2779-88. doi: 10.2527/jas.2016-0425. J Anim Sci. 2016. PMID: 27482665
-
Linkage disequilibrium, persistence of phase and effective population size estimates in Hereford and Braford cattle.BMC Genet. 2016 Feb 1;17:32. doi: 10.1186/s12863-016-0339-8. BMC Genet. 2016. PMID: 26832943 Free PMC article.
-
Short communication: Characterization of the genome-wide linkage disequilibrium in 2 divergent selection lines of dairy cows.J Dairy Sci. 2010 Jun;93(6):2775-8. doi: 10.3168/jds.2009-2613. J Dairy Sci. 2010. PMID: 20494187
-
High density linkage disequilibrium maps of chromosome 14 in Holstein and Angus cattle.BMC Genet. 2008 Jul 8;9:45. doi: 10.1186/1471-2156-9-45. BMC Genet. 2008. PMID: 18611270 Free PMC article.
Cited by
-
Use of partial least squares regression to impute SNP genotypes in Italian cattle breeds.Genet Sel Evol. 2013 Jun 5;45(1):15. doi: 10.1186/1297-9686-45-15. Genet Sel Evol. 2013. PMID: 23738947 Free PMC article.
-
Characterizing homozygosity across United States, New Zealand and Australian Jersey cow and bull populations.BMC Genomics. 2015 Mar 15;16(1):187. doi: 10.1186/s12864-015-1352-4. BMC Genomics. 2015. PMID: 25879195 Free PMC article.
-
Maximizing crossbred performance through purebred genomic selection.Genet Sel Evol. 2015 Mar 14;47(1):16. doi: 10.1186/s12711-015-0099-3. Genet Sel Evol. 2015. PMID: 25887297 Free PMC article.
-
Methods to estimate effective population size using pedigree data: Examples in dog, sheep, cattle and horse.Genet Sel Evol. 2013 Jan 2;45(1):1. doi: 10.1186/1297-9686-45-1. Genet Sel Evol. 2013. PMID: 23281913 Free PMC article.
-
Genomic prediction for numerically small breeds, using models with pre-selected and differentially weighted markers.Genet Sel Evol. 2018 Oct 10;50(1):49. doi: 10.1186/s12711-018-0419-5. Genet Sel Evol. 2018. PMID: 30314431 Free PMC article.
References
-
- Abecasis, G. R., and W. O. C. Cookson, 2000. GOLD—graphical overview of linkage disequilibrium. Bioinformatics 16 182–183. - PubMed
-
- Andersson, L., 2001. Genetic dissection of phenotypic diversity in farm animals. Nat. Rev. Genet. 2 130–138. - PubMed
-
- Ardlie, G. A., L. Kruglyak and M. Seielstad, 2002. Patterns of linkage disequilibrium in the human genome. Nat. Rev. Genet. 3 299–309. - PubMed
-
- Arthur, P. F., J. A. Archer, D. J. Johnston, R. M. Herd, E. C. Richardson et al., 2001. Genetic and phenotypic variance and covariance components for feed intake, feed efficiency, and other postweaning traits in Angus cattle. J. Anim. Sci. 79 2805–2811. - PubMed
MeSH terms
LinkOut - more resources
Full Text Sources
Other Literature Sources
Research Materials
Miscellaneous
