. 2008 Aug;11(8):901-7.
doi: 10.1038/nn.2156. Epub 2008 Jul 11.

Neurons born in the adult dentate gyrus form functional synapses with target cells

Affiliations

Neurons born in the adult dentate gyrus form functional synapses with target cells

Nicolas Toni et al. Nat Neurosci. 2008 Aug.

Abstract

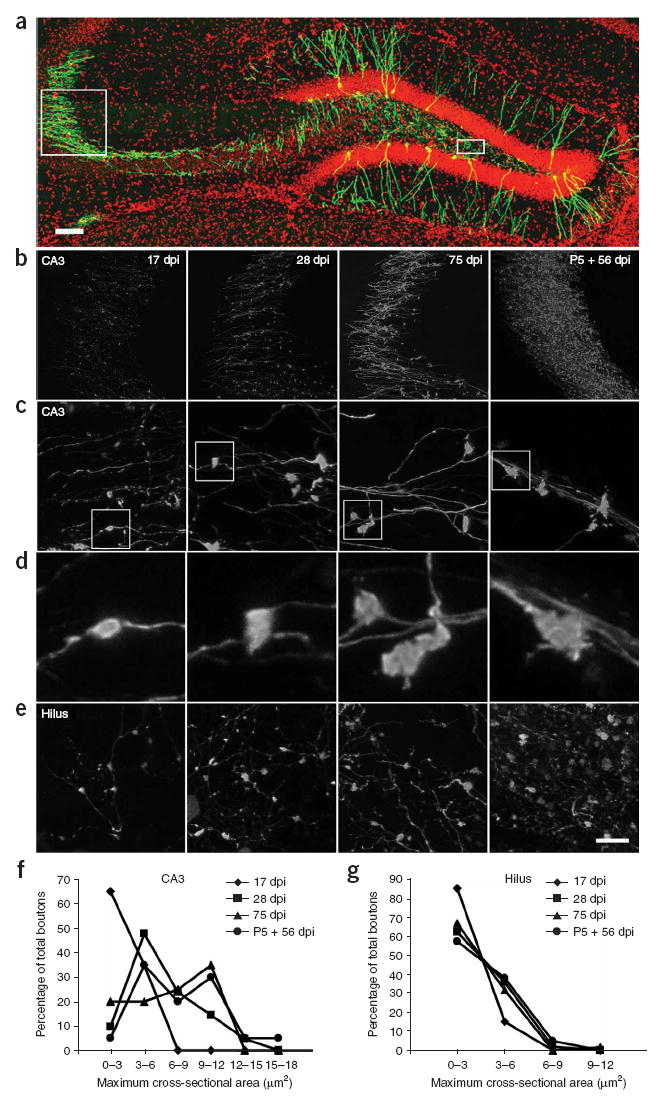
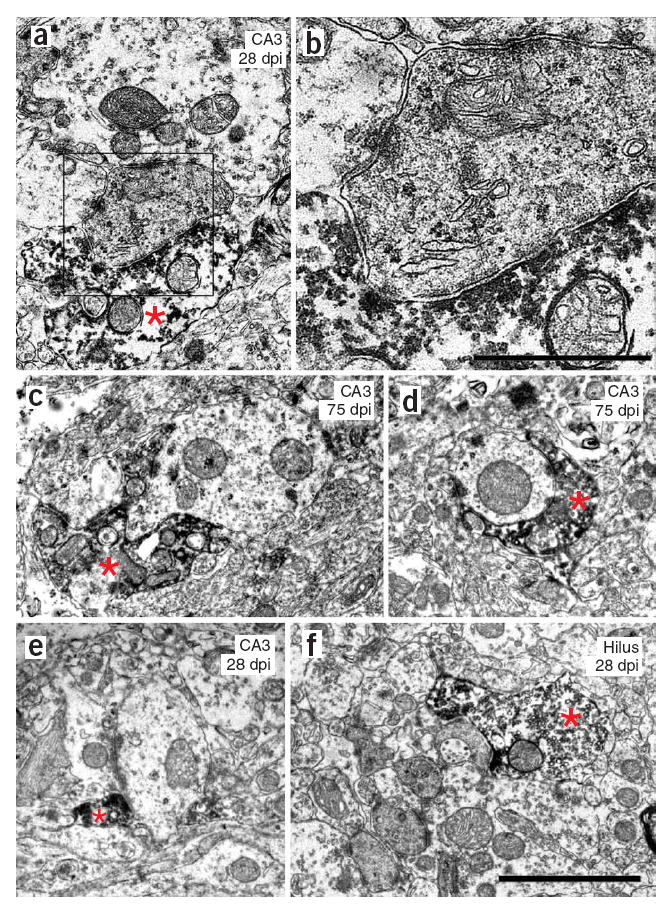
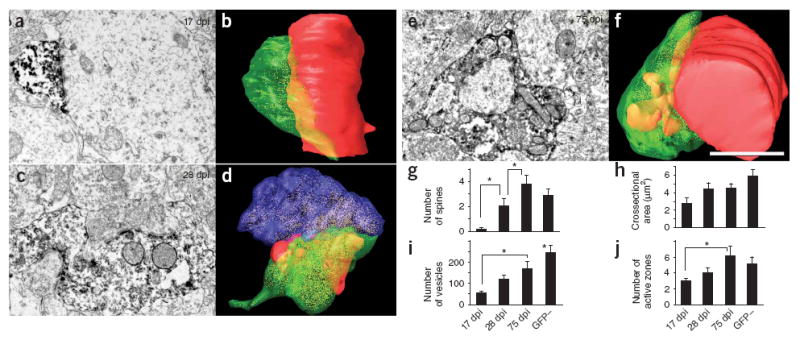
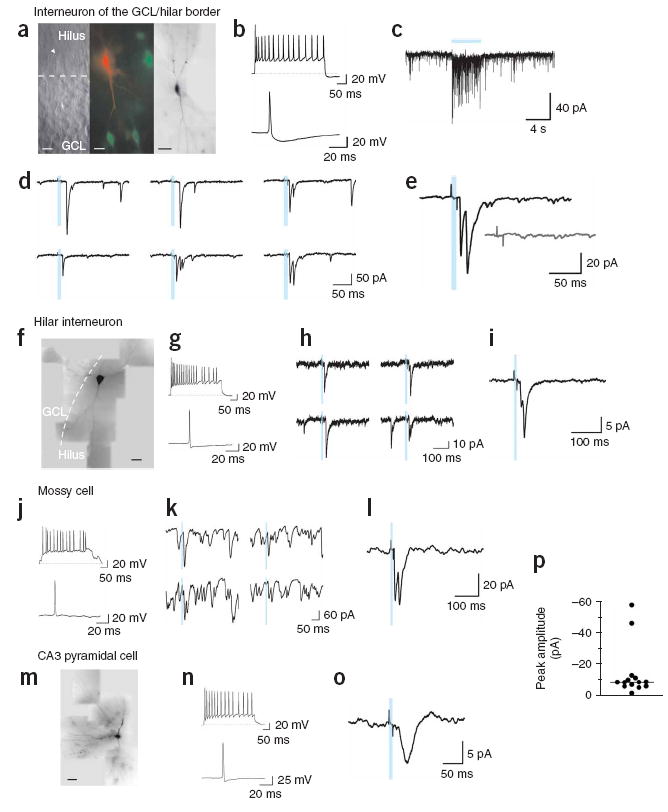
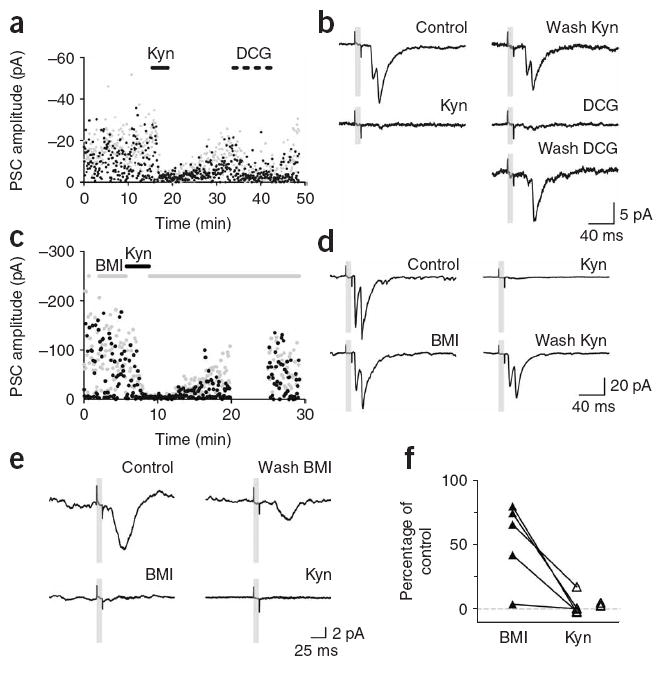
Adult neurogenesis occurs in the hippocampus and the olfactory bulb of the mammalian CNS. Recent studies have demonstrated that newborn granule cells of the adult hippocampus are postsynaptic targets of excitatory and inhibitory neurons, but evidence of synapse formation by the axons of these cells is still lacking. By combining retroviral expression of green fluorescent protein in adult-born neurons of the mouse dentate gyrus with immuno-electron microscopy, we found output synapses that were formed by labeled terminals on appropriate target cells in the CA3 area and the hilus. Furthermore, retroviral expression of channelrhodopsin-2 allowed us to light-stimulate newborn granule cells and identify postsynaptic target neurons by whole-cell recordings in acute slices. Our structural and functional evidence indicates that axons of adult-born granule cells establish synapses with hilar interneurons, mossy cells and CA3 pyramidal cells and release glutamate as their main neurotransmitter.


Figures

Figure 1
Figure 1. Confocal microscopy of mossy fiber boutons from newborn neurons
(a) An overview of the hippocampus with a subpopulation of adult-born neurons in green. Boxed areas indicate the area analyzed in CA3 (left) and the hilus (right). (b) Examples of mossy fiber axons labeled with retrovirus at 17, 28 and 75 dpi after virus injection into 6–7-week-old female mice and at 56 dpi after virus injection into a mouse pup at postnatal day 5 (labeled as P5). (c) High-magnification views of mossy fiber boutons in CA3. (d) Enlarged views of representative boutons that are boxed in c. (e) High-magnification views of mossy fiber boutons in the hilus. Panels in c, d and e are arranged in the same time point order as b. (f) Distribution of the size of mossy fiber boutons at different time points in CA3. Mossy fiber boutons were grouped according to their size, and the percentage of boutons in each size group was quantified. The size of mossy fiber boutons in CA3 was significantly smaller at 17 dpi than at any other time points (t (77) = 10.50, P < 0.001, Fisher’s PLSD; 17 dpi versus all other time points, P < 0.002; 28 dpi versus 75 dpi, P = 0.42; 28 dpi versus P5 + 56 dpi, P = 0.033; 75 dpi versus P5 + 56 dpi, P = 0.18). (g) Distribution of the size of mossy fiber boutons at different time points in the hilus. (t (156) = 0.54, P = 0.65). Data are presented as means ± s.e.m. Red, DAPI; green, GFP. Scale bars represent 50 μm in a, 60 μm in b, 10 μm in c and e, and 2.5 μm in d.
Figure 2
Figure 2. Electron micrographs illustrating the diversity of synapses made by newly generated neurons
(a,b) GFP-positive mossy terminal synapsing on a thorny excrescence in the CA3 area at 28 dpi The boxed area is enlarged in b. (c) GFP-positive mossy terminal synapsing on a thin, spiny dendrite in the CA3 at 75 dpi. (d) Bouton en passant synapsing on a thin, aspiny dendrite in the CA3 area at 75 dpi. (e) Bouton en passant synapsing on a thin, aspiny dendrite in the CA3 at 28 dpi. (f) Mossy terminal synapsing on a thorny excrescence in the hilus at 28 dpi. Scale bars represent 2 μm in a and cf, and 0.8 μm in b. Asterisks indicate GFP-positive axon terminal.
Figure 3
Figure 3. Temporal progression of the morphology of GFP-positive axon terminals in the CA3 area
(a,b) At 17 dpi, small boutons contacted dendritic shafts. (c,d) At 28 dpi, GFP-positive larger mossy terminals contacted thorny excrescences that were also contacted by GFP-negative mossy terminals. (e,f) At 75 dpi, mossy terminals contacted individual thorny excrescences. The boutons shown in the electron micrographs in a, c and e were serially sectioned and three-dimensionally reconstructed in b, d and f. Scale bar represents 1.5 μm. Green, GFP-positive bouton; red, dendrites and spines that synapsed with the GFP-positive boutons; blue, unlabeled axon terminal that shared postsynaptic targets with the GFP-positive bouton. (g) Number of spines indenting into GFP-positive boutons, as observed on the largest section. The number at 17 dpi was significantly smaller than at any other time point (t (31) = 6.85, P = 0.01, Fisher’s PLSD; 17 versus 28 dpi, P = 0.03; 28 versus 75 dpi, P = 0.03; 75 dpi versus GFP-negative boutons, P = 0.25). (h) Cross-sectional area of GFP-positive boutons at the largest section (t (31) = 3.62, P = 0.02). (i) Number of presynaptic vesicles in the largest section (t (31) = 7.02, P < 0.001, Fisher’s PLSD; 17 versus 75 dpi, P = 0.01; 17 dpi versus GFP-negative, P < 0.001; 28 dpi versus GFP-negative, P < 0.005; 75 dpi versus GFP-negative, P < 0.05). (j) Number of active zones in the largest section (t (31) = 2.08, P = 0.12, Fisher’s PLSD; 17 versus 75 dpi, P < 0.05). * P < 0.05. Data are presented as means ± s.e.m.
Figure 4
Figure 4. Light-evoked neurotransmitter release from adult-born neurons expressing ChR2
(ae) GCL/hilar border interneuron. (a) Left, infrared microscopy of a patched neuron (arrowhead). The dashed line divides GCL from hilus. Middle, merged images showing the patched neuron filled with Alexa Fluor 543 (red) and ChR2-GFP-positive granule cells (green). Right, reconstruction of the filled neuron showing bipolar morphology, with dendrites extending toward the GCL and hilus. Scale bars represent 20 μm (left, middle) and 50 μm (right). (b) Top, 40-Hz spike train in response to a 750-pA pulse. Bottom, spike elicited by a 50-pA current. (c) Synaptic activity evoked by a prolonged light stimulus (blue bar). (d) Example PSCs elicited by 10-ms light stimuli (blue bars) delivered at 0.2 Hz. (e) Average of 45 responses. PSC delay to onset was 15.2 ms and failure probability of first peak was 0.36. Inset, average of 38 traces evoked with a blocked light path. (fi) Hilar interneuron. (f) Dye-filled neuron with multipolar morphology and dendrites extending through the hilus and GCL. Scale bar represents 50 μm. (g) Top, 50-Hz spike train in response to 700 pA. Bottom, spike elicited by 50 pA. (h) Example PSCs. (i) Average of 179 responses to repeated stimuli (1 Hz). The PSC delay was 21.9 ms and the failure probability was 0.56. (jl) Hilar mossy cell. (j) Top, 35-Hz spike train in response to 250 pA. Bottom, spike elicited by 100 pA. (k) Example PSCs showing high frequency of spontaneous synaptic activity. (l) Average of 445 PSCs (1 Hz). PSC onset was 14.2 ms. (mo) CA3 pyramidal cell. (m) Filled neuron showing the soma in the CA3 pyramidal layer, with basal and apical dendrites. Scale bar represents 50 μm. (n) Top, 35-Hz spike train in response to 350 pA. Bottom: spike in response to 50 pA. (o) Average of 400 PSCs (1 Hz). PSC onset was 25.1 ms. (p) Average peak amplitude of all light-evoked PSCs (n = 14 cells). The horizontal line denotes the median.
Figure 5
Figure 5. Pharmacological treatments demonstrate glutamate release by adult-born neurons
(a) Amplitude of the first and second peak (black and gray dots) of PSCs evoked by repetitive light pulses (0.2 Hz). Application of 10 mM Kyn and DCG-IV (DCG, 1 μM) is indicated by the solid and dotted bars. DCG increased failure probability from 0.27 to 0.85 (same cell as in Fig. 4f–i). (b) Consecutive average traces from the experiment shown in a, taken before, during or after the indicated treatments. (c) Amplitude of the first and second peak of single light-evoked PSCs (0.2-Hz stimulation). Application of 20 μM BMI and 4 mM Kyn is indicated by the gray and black horizontal bars (acquisition was interrupted from 20–25 min; same cell as in Fig. 2a–e). (d) Consecutive average traces from the experiment shown in d, taken before, during or after the indicated treatments. (e) Pharmacology of light-evoked PSCs on a pyramidal cell. Consecutive average traces show a full blockade of PSCs by BMI, partial recovery after drug washout and then full blockade by Kyn. (f) Amplitude of light-evoked PSCs in the presence of BMI (n = 5) or Kyn (n = 8) relative to their amplitude without drugs. Lines connect values obtained in the same neurons. Experiments where BMI was not applied are shown to the right.

References

    1. Schinder AF, Gage FH. A hypothesis about the role of adult neurogenesis in hippocampal function. Physiology (Bethesda) 2004;19:253–261. - PubMed
    1. Ming GL, Song H. Adult neurogenesis in the mammalian central nervous system. Annu Rev Neurosci. 2005;28:223–250. - PubMed
    1. Aimone JB, Wiles J, Gage FH. Potential role for adult neurogenesis in the encoding of time in new memories. Nat Neurosci. 2006;9:723–727. - PubMed
    1. Lledo PM, Alonso M, Grubb MS. Adult neurogenesis and functional plasticity in neuronal circuits. Nat Rev Neurosci. 2006;7:179–193. - PubMed
    1. Zhao C, Deng W, Gage FH. Mechanisms and functional implications of adult neurogenesis. Cell. 2008;132:645–660. - PubMed

Publication types

MeSH terms