The auditory cortex of the bat Phyllostomus discolor: Localization and organization of basic response properties
- PMID: 18625034
- PMCID: PMC2483289
- DOI: 10.1186/1471-2202-9-65
The auditory cortex of the bat Phyllostomus discolor: Localization and organization of basic response properties
Abstract
Background: The mammalian auditory cortex can be subdivided into various fields characterized by neurophysiological and neuroarchitectural properties and by connections with different nuclei of the thalamus. Besides the primary auditory cortex, echolocating bats have cortical fields for the processing of temporal and spectral features of the echolocation pulses. This paper reports on location, neuroarchitecture and basic functional organization of the auditory cortex of the microchiropteran bat Phyllostomus discolor (family: Phyllostomidae).
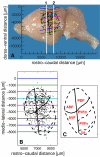
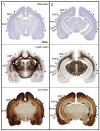
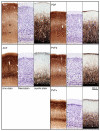
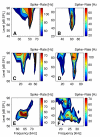
Results: The auditory cortical area of P. discolor is located at parieto-temporal portions of the neocortex. It covers a rostro-caudal range of about 4800 mum and a medio-lateral distance of about 7000 mum on the flattened cortical surface. The auditory cortices of ten adult P. discolor were electrophysiologically mapped in detail. Responses of 849 units (single neurons and neuronal clusters up to three neurons) to pure tone stimulation were recorded extracellularly. Cortical units were characterized and classified depending on their response properties such as best frequency, auditory threshold, first spike latency, response duration, width and shape of the frequency response area and binaural interactions. Based on neurophysiological and neuroanatomical criteria, the auditory cortex of P. discolor could be subdivided into anterior and posterior ventral fields and anterior and posterior dorsal fields. The representation of response properties within the different auditory cortical fields was analyzed in detail. The two ventral fields were distinguished by their tonotopic organization with opposing frequency gradients. The dorsal cortical fields were not tonotopically organized but contained neurons that were responsive to high frequencies only.
Conclusion: The auditory cortex of P. discolor resembles the auditory cortex of other phyllostomid bats in size and basic functional organization. The tonotopically organized posterior ventral field might represent the primary auditory cortex and the tonotopically organized anterior ventral field seems to be similar to the anterior auditory field of other mammals. As most energy of the echolocation pulse of P. discolor is contained in the high-frequency range, the non-tonotopically organized high-frequency dorsal region seems to be particularly important for echolocation.
Figures


Similar articles
-
Auditory cortex of the rufous horseshoe bat: 1. Physiological response properties to acoustic stimuli and vocalizations and the topographical distribution of neurons.Eur J Neurosci. 1995 Apr 1;7(4):570-91. doi: 10.1111/j.1460-9568.1995.tb00662.x. Eur J Neurosci. 1995. PMID: 7620609
-
Tonotopic organization and parcellation of auditory cortex in the FM-bat Carollia perspicillata.Eur J Neurosci. 1999 Oct;11(10):3669-82. doi: 10.1046/j.1460-9568.1999.00789.x. Eur J Neurosci. 1999. PMID: 10564374
-
Functional organization of the pallid bat auditory cortex: emphasis on binaural organization.J Neurophysiol. 2002 Jan;87(1):72-86. doi: 10.1152/jn.00226.2001. J Neurophysiol. 2002. PMID: 11784731
-
Neural maps for target range in the auditory cortex of echolocating bats.Curr Opin Neurobiol. 2014 Feb;24(1):68-75. doi: 10.1016/j.conb.2013.08.016. Epub 2013 Sep 17. Curr Opin Neurobiol. 2014. PMID: 24492081 Review.
-
Modular organization of frequency integration in primary auditory cortex.Annu Rev Neurosci. 2000;23:501-29. doi: 10.1146/annurev.neuro.23.1.501. Annu Rev Neurosci. 2000. PMID: 10845073 Review.
Cited by
-
Representation of three-dimensional space in the auditory cortex of the echolocating bat P. discolor.PLoS One. 2017 Aug 16;12(8):e0182461. doi: 10.1371/journal.pone.0182461. eCollection 2017. PLoS One. 2017. PMID: 28813464 Free PMC article.
-
Quantification of mid and late evoked sinks in laminar current source density profiles of columns in the primary auditory cortex.Front Neural Circuits. 2015 Oct 2;9:52. doi: 10.3389/fncir.2015.00052. eCollection 2015. Front Neural Circuits. 2015. PMID: 26557058 Free PMC article.
-
Sound-evoked oscillation and paradoxical latency shift in the inferior colliculus neurons of the big fruit-eating bat, Artibeus jamaicensis.J Comp Physiol A Neuroethol Sens Neural Behav Physiol. 2011 Dec;197(12):1159-72. doi: 10.1007/s00359-011-0678-x. Epub 2011 Sep 13. J Comp Physiol A Neuroethol Sens Neural Behav Physiol. 2011. PMID: 21912875
-
Auditory cortical regions show resting-state functional connectivity with the default mode-like network in echolocating bats.Proc Natl Acad Sci U S A. 2024 Jul 2;121(27):e2306029121. doi: 10.1073/pnas.2306029121. Epub 2024 Jun 24. Proc Natl Acad Sci U S A. 2024. PMID: 38913894 Free PMC article.
-
Complexin-1 enhances ultrasound neurotransmission in the mammalian auditory pathway.Nat Genet. 2024 Jul;56(7):1503-1515. doi: 10.1038/s41588-024-01781-z. Epub 2024 Jun 4. Nat Genet. 2024. PMID: 38834904
References
-
- Esser KH, Lud B. Discrimination of sinusoidally frequency-modulated sound signals mimicking species-specific communication calls in the FM-bat Phyllostomus discolor. J Comp Physiol [A] 1997;180:513–522. - PubMed
-
- Firzlaff U, Schuller G. Cortical responses to object size-dependent spectral interference patterns in echolocating bats. Eur J Neurosci. 2007;26:2747–2755. - PubMed
-
- Esser KH, Schmidt U. Behavioral auditory thresholds in neonate lesser spear-nosed bats, Phyllostomus discolor. Naturwissenschaften. 1990;77:292–294. - PubMed
Publication types
MeSH terms
LinkOut - more resources
Full Text Sources
Research Materials

