

Do estimates of cost-utility based on the EQ-5D differ from those based on the mapping of utility scores?
- PMID: 18625052
- PMCID: PMC2490675
- DOI: 10.1186/1477-7525-6-51
Do estimates of cost-utility based on the EQ-5D differ from those based on the mapping of utility scores?
Abstract
Background: Mapping has been used to convert scores from condition-specific measures into utility scores, and to produce estimates of cost-effectiveness. We sought to compare the QALY gains, and incremental cost per QALY estimates, predicted on the basis of mapping to those based on actual EQ-5D scores.
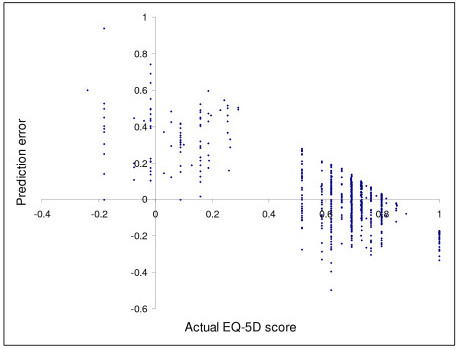
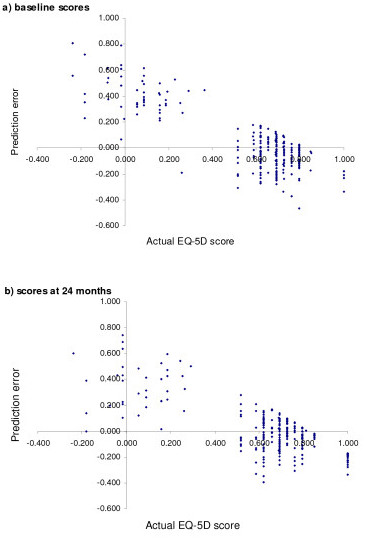
Methods: In order to compare 4 different interventions 389 individuals were asked to complete both the EQ-5D and the Western Ontartio and McMaster Universities Osteoarthritis Index (WOMAC) at baseline, 6, 12, and 24 months post-intervention. Using baseline data various mapping models were developed, where WOMAC scores were used to predict the EQ-5D scores. The performance of these models was tested by predicting the EQ-5D post-intervention scores. The preferred model (that with the lowest mean absolute error (MAE)) was used to predict the EQ-5D scores, at all time points, for individuals who had complete WOMAC and EQ-5D data. The mean QALY gain associated with each intervention was calculated, using both actual and predicted EQ-5D scores. These QALY gains, along with previously estimated changes in cost, were also used to estimate the actual and predicted incremental cost per QALY associated with each of the four interventions.
Results: The EQ-5D and the WOMAC were completed at baseline by 348 individuals, and at all time points by 259 individuals. The MAE in the preferred model was 0.129, and the mean QALY gains for each of the four interventions was predicted to be 0.006, 0.058, 0.058, and 0.136 respectively, compared to the actual mean QALY gains of 0.087, 0.081, 0.120, and 0.149. The most effective intervention was estimated to be associated with an incremental cost per QALY of pound6,068, according to our preferred model, compared to pound13,154 when actual data was used.
Conclusion: We found that actual QALY gains, and incremental cost per QALY estimates, differed from those predicted on the basis of mapping. This suggests that though mapping may be of value in predicting the cost-effectiveness of interventions which have not been evaluated using a utility measure, future studies should be encouraged to include a method of actual utility measurement.
Trial registration: Current Controlled Trials ISRCTN93206785.
Figures
References
-
- Drummond MF, Sculpher MJ, Torrance GW, O'Brien BJ, Stoddart GL. Methods for the Economic Evaluation of Health Care Programmes. 3. New York: Oxford University Press; 2005.
-
- Brazier JE, Ratcliffe J, Salomon JA, Tsuchiya A. Measuring and Valuing Health Benefits for Economic Evaluation. New York: Oxford University Press Inc.; 2007.
Publication types
MeSH terms
Associated data
Grants and funding
LinkOut - more resources
Full Text Sources
Medical
