. 2008 Jul 15;22(14):1948-61.
doi: 10.1101/gad.1661708.

Transcriptional coactivators PGC-1alpha and PGC-lbeta control overlapping programs required for perinatal maturation of the heart

Affiliations

Transcriptional coactivators PGC-1alpha and PGC-lbeta control overlapping programs required for perinatal maturation of the heart

Ling Lai et al. Genes Dev. .

Abstract

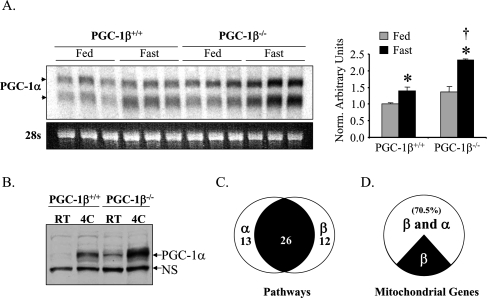
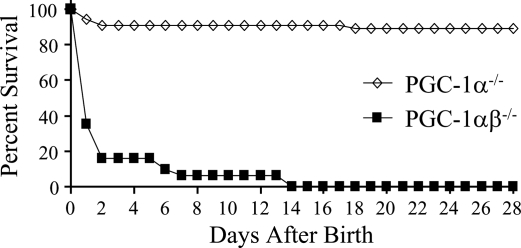
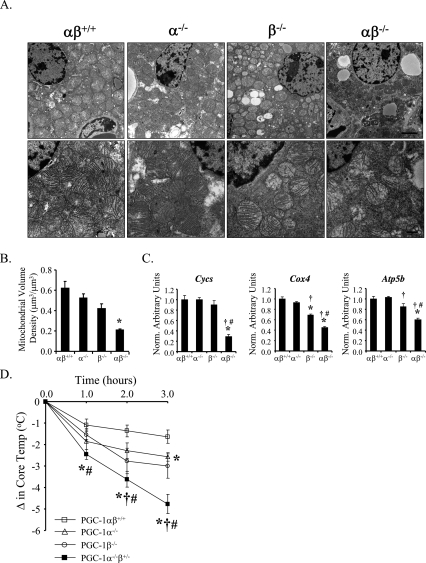
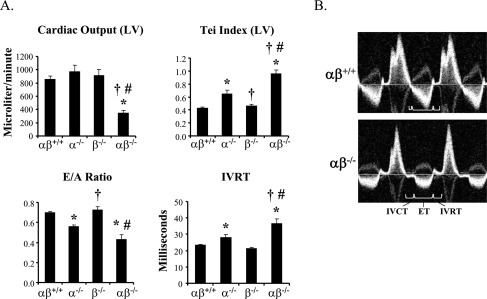
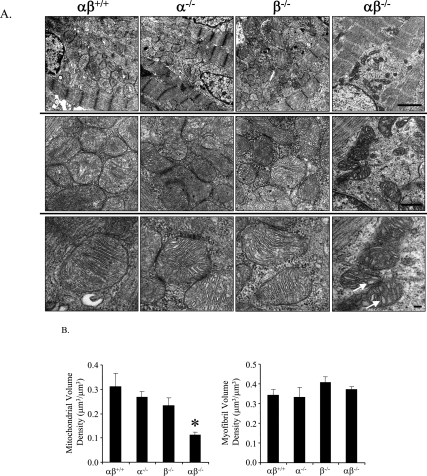
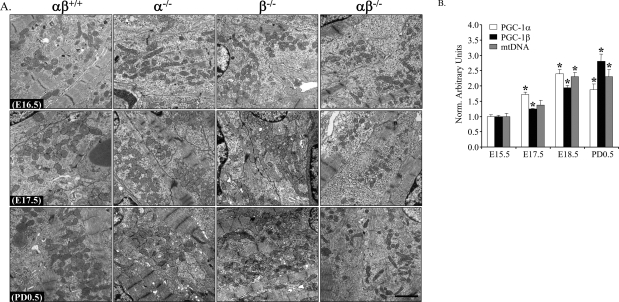
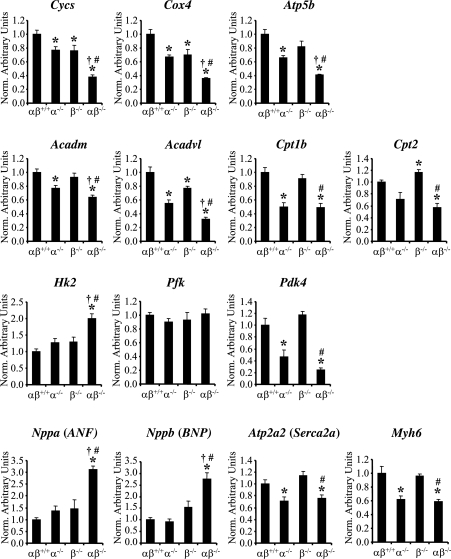
Oxidative tissues such as heart undergo a dramatic perinatal mitochondrial biogenesis to meet the high-energy demands after birth. PPARgamma coactivator-1 (PGC-1) alpha and beta have been implicated in the transcriptional control of cellular energy metabolism. Mice with combined deficiency of PGC-1alpha and PGC-1beta (PGC-1alphabeta(-/-) mice) were generated to investigate the convergence of their functions in vivo. The phenotype of PGC-1beta(-/-) mice was minimal under nonstressed conditions, including normal heart function, similar to that of PGC-1alpha(-/-) mice generated previously. In striking contrast to the singly deficient PGC-1 lines, PGC-1alphabeta(-/-) mice died shortly after birth with small hearts, bradycardia, intermittent heart block, and a markedly reduced cardiac output. Cardiac-specific ablation of the PGC-1beta gene on a PGC-1alpha-deficient background phenocopied the generalized PGC-1alphabeta(-/-) mice. The hearts of the PGC-1alphabeta(-/-) mice exhibited signatures of a maturational defect including reduced growth, a late fetal arrest in mitochondrial biogenesis, and persistence of a fetal pattern of gene expression. Brown adipose tissue (BAT) of PGC-1alphabeta(-/-) mice also exhibited a severe abnormality in function and mitochondrial density. We conclude that PGC-1alpha and PGC-1beta share roles that collectively are necessary for the postnatal metabolic and functional maturation of heart and BAT.


Figures

Figure 1.
Figure 1.
PGC-1α and PGC-1β drive a significant subset of overlapping gene regulatory programs. (A, left) Representative autoradiograph of a Northern blot using RNA isolated from heart of PGC-1β+/+ and PGC-1β−/− mice on standard chow (Fed) or post 36 h fast (Fast) is shown using a full-length PGC-1α cDNA as a probe. PGC-1α transcripts are denoted by the arrows. Ethidium bromide staining of 28s ribosomal RNA is shown at the bottom as a loading control. (Right) Quantitative RT–PCR (TaqMan) of total RNA from heart was used to characterize the level of PGC-1α gene expression in fed (gray bar) and fasted (black bars) PGC-1β+/+ and PGC-1β−/− hearts. The mRNA levels were normalized to 36Β4 mRNA content, and are shown relative to the PGC-1β+/+ fed values (=1.0). (*) P < 0.05 compared with the fed group of the same genotype; (†) P < 0.05 compared with the fasted group of the PGC-1β+/+. (B) Western blot analysis of whole-cellprotein extracts preparedfromBAT of PGC-1β+/+ and PGC-1β−/− mice at room temperature or at 4°C. The top arrow designates the full-length PGC-1α protein. A nonspecific band (NS) is shown as a loading control. (C–D) NRCM in culture were infected with Ad-GFP, Ad-PGC-1α, or Ad-PGC-1β, and gene expression array analysis was performed using the Affymetrix Rat Expression Set 230 chip. (C) Venn diagram showing the Gene Ontology pathways that were up-regulated by either PGC-1α or PGC-1β compared with Ad-GFP-infected cells. The left circle represents the pathways up-regulated by PGC-1α, and right circle represents those up-regulated by PGC-1β with overlapping portion (black) representing pathways up-regulated by both. (D) The pie chart represents genes in the Gene Ontology category “mitochondrion” that were up-regulated at least 1.5-fold by PGC-1β compared with Ad-GFP-infected cells (P < 0.05). The white portion represents those that were also up-regulated by PGC-1α by at least 1.5-fold (P < 0.05).
Figure 2.
Figure 2.
Deficiency of both PGC-1α and PGC-1β is lethal. Mortality curve depicting the percent survival of male and female PGC-1α−/− (diamonds, n = 55) and PGC-1αβ-deficient (PGC-1αβ−/−, squares, n = 31) pups 28 d after birth.
Figure 3.
Figure 3.
BAT phenotype in PGC-1αβ-deficient mice. (A) Representative electron micrographs of BAT at PD0.5 from wild-type (αβ+/+), PGC-1α−/−−/−), PGC-1β−/−−/−), and PGC-1αβ−/− (αβ−/−) mice at two different magnifications. Each genotype label denotes the vertical column below it. Bars: top row, 2 μm; bottom row, 500 nm. (B) Quantitative morphometric measurements of the cellular volume density for the mitochondrial fraction based on analysis of electron micrographs. Bars represent mean ± SEM. (*) P < 0.05 compared with αβ+/+. (C) Quantitative real-time RT–PCR analysis of RNA extracted from hearts of PD0.5 wild-type, PGC-1α−/−, PGC-1β−/−, and PGC-1αβ−/− mice for the following: oxidative phosphorylation-cytochrome c, somatic (Cycs), cytochrome oxidase 4 (Cox4), ATP synthase, H+ transporting, mitochondrial F1 complex, β polypeptide (Atp5b). The mRNA levels were normalized to 18s rRNA content, and expressed relative to PGC-1αβ+/+ values. Bars represent mean ± SEM. (*) P < 0.05 compared with αβ+/+; (†) P < 0.05 compared with α−/−; (#) P < 0.05 compared with β−/−. (D) Thirty-six-day-old to 42-d-old PGC-1αβ+/+ (open squares, n = 11), PGC-1α−/− (open triangle, n = 7), PGC-1β−/− (open circle, n = 13), and PGC-1α−/−β+/− mice (black squares, n = 13) were subjected to cold (4°C). The change in core temperature ± SEM is shown in the graph as a function of time. (*) P < 0.05, compared with αβ+/+; (†) P < 0.05 compared with α−/−; (#) P < 0.05 compared with β−/−.
Figure 4.
Figure 4.
Evidence for cardiac failure in PGC-1αβ-deficient mice. To evaluate cardiac function noninvasively in all four genotypes, high-resolution echocardiography was performed within a few hours after birth. (A) Bar graphs show representative indices of systolic (cardiac output), diastolic (E/A ratio, IVRT), and combined (Tei index) left ventricular performance. (B) Representative images of the trans-mitral/left ventricular outflow tract (LVOT) Doppler spectra from wild-type (αβ+/+) and PGC-1αβ−/− (αβ−/−) mice demonstrate markedly altered cardiac time intervals and reduced LVOT velocities in the double null mice. (IVRT) Isovolumic relaxation time; (IVCT) isovolumic contraction time; (ET) ejection time.
Figure 5.
Figure 5.
Abnormal mitochondrial density and structure in hearts of PGC-1αβ−/− mice. (A) Representative electron micrographs of cardiac muscle (LV free wall) at PD0.5 from wild-type (αβ+/+), PGC-1α−/−−/−), PGC-1β−/−−/−), and PGC-1αβ−/− (αβ−/−) mice at three different magnifications. Each genotype label denotes the vertical column below it. Bars: top row, 2 μm; middle row, 500 nm; bottom row, 100 nm. Arrows indicate vacuolar abnormalities within mitochondria of the PGC-1αβ−/− mice. (B) Quantitative morphometric measurements of the cellular volume density for the mitochondrial (left) and myofibrilar (right) fractions based on analysis of electron micrographs. Bars represent mean ± SEM. (*) P < 0.05 compared with αβ+/+.
Figure 6.
Figure 6.
Perinatal mitochondrial biogenesis is blocked in PGC-1αβ−/− hearts. (A) Representative electron micrographs of cardiac muscle sections (LV free wall) at E16.5 (top panels), E17.5 (middle panels), and PD0.5 (bottom panels) from wild-type (αβ+/+), PGC-1α−/−−/−), PGC-1β−/−−/−), and PGC-1αβ−/− (αβ−/−) mice. Bar, 2 μm. (B) Quantitative real-time RT–PCR analysis of RNA extracted from hearts of E15.5, E17.5, E18.5, and PD0.5 C57BL6/J mice for the expression of PGC-1α (white bars) and PGC-1β (black bars) genes. The mRNA levels were normalized to 36B4 mRNA levels, and expressed relative to E15.5 values (=1.0). Quantitative PCR of total DNA from heart was performed to quantify mitochondrial DNA (gray bars) using primers for NADH dehydrogenase (ND1) and genomic DNA using primers for lipoprotein lipase (LPL). The ND1 levels were normalized to LPL DNA content, and expressed relative to E15.5 values (=1.0). Bars represent mean ± SEM. (*) P < 0.05 compared with E15.5.
Figure 7.
Figure 7.
Cardiac gene expression markers are consistent with a block in fetal–adult transition. Quantitative real-time RT–PCR analysis of RNA extracted from hearts of PD0.5 wild-type (αβ+/+), PGC-1α−/−−/−), PGC-1β−/−−/−), and PGC-1αβ−/− (αβ−/−) mice for the following: oxidative phosphorylation-cytochrome c, somatic (Cycs), cytochrome oxidase 4 (Cox4), ATP synthase, H+ transporting, mitochondrial F1 complex, β polypeptide (Atp5b); fatty acid oxidation-acetyl-Coenzyme A dehydrogenase, medium chain (Acadm), acyl-Coenzyme A dehydrogenase, very long chain (Acadvl), carnitine palmitoyltransferase 1b (Cpt1b), carnitine palmitoyltransferase 2 (Cpt2); Glycolysis/Glucose oxidation-hexokinase 2 (Hk2), phosphofructokinase (Pfk), pyruvate dehydrogenase kinase 4 (Pdk4); General adult cardiac gene markers-atrial natriuretic factor (ANF), brain natriuretic peptide (BNP), ATPase, Ca2+ transporting, cardiac muscle, slow twitch 2 (Serca2a), and α-myosin heavy chain (Myh6). The mRNA levels were normalized to β-actin mRNA content, and expressed relative to PGC-1αβ+/+ values. Bars represent mean ± SEM. (*) P < 0.05 compared with αβ+/+; (†) P < 0.05 compared with α−/−; (#) P < 0.05 compared with β−/−.

References

    1. Agah R., Frenkel P.A., French B.A., Michael L.H., Overbeek P.A., Schneider M.D. Gene recombination in postmitotic cells. Targeted expression of cre recombinase provokes cardiac-restricted, site-specific rearrangement in adult ventricular muscle in vivo. J. Clin. Invest. 1997;100:169–179. - PMC - PubMed
    1. Alaynick W.A., Kondo R.P., Xie W., He W., Dufour C.R., Downes M., Jonker J.W., Giles W., Naviaux R.K., Giguère V., et al. ERRγ directs and maintains the transition to oxidative metabolism in the postnatal heart. Cell Metab. 2007;6:13–24. - PubMed
    1. Andersson U., Scarpulla R.C. PGC-1-related coactivator, a novel, serum-inducible coactivator of nuclear respiratory factor-1-dependent transcription in mammalian cells. Mol. Cell. Biol. 2001;21:3738–3749. - PMC - PubMed
    1. Arany Z., Novikov M., Chin S., Ma Y., Rosenzweig A., Spiegelman B.M. Transverse aortic constriction leads to accelerated heart failure in mice lacking PPARγ coactivator 1α. Proc. Natl. Acad. Sci. 2006;103:10086–10091. - PMC - PubMed
    1. Arany Z., Lebrasseur N., Morris C., Smith E., Yang W., Ma Y., Chin S., Spiegelman B.M. The transcriptional coactivator PGC-1β drives the formation of oxidative type IIX fibers in skeletal muscle. Cell Metab. 2007;5:35–46. - PubMed

Publication types

Substances

LinkOut - more resources