. 2008 Nov;28(11):1860-75.
doi: 10.1038/jcbfm.2008.77. Epub 2008 Jul 16.

Genomic profiles of damage and protection in human intracerebral hemorrhage

Affiliations

Genomic profiles of damage and protection in human intracerebral hemorrhage

S Thomas Carmichael et al. J Cereb Blood Flow Metab. 2008 Nov.

Abstract

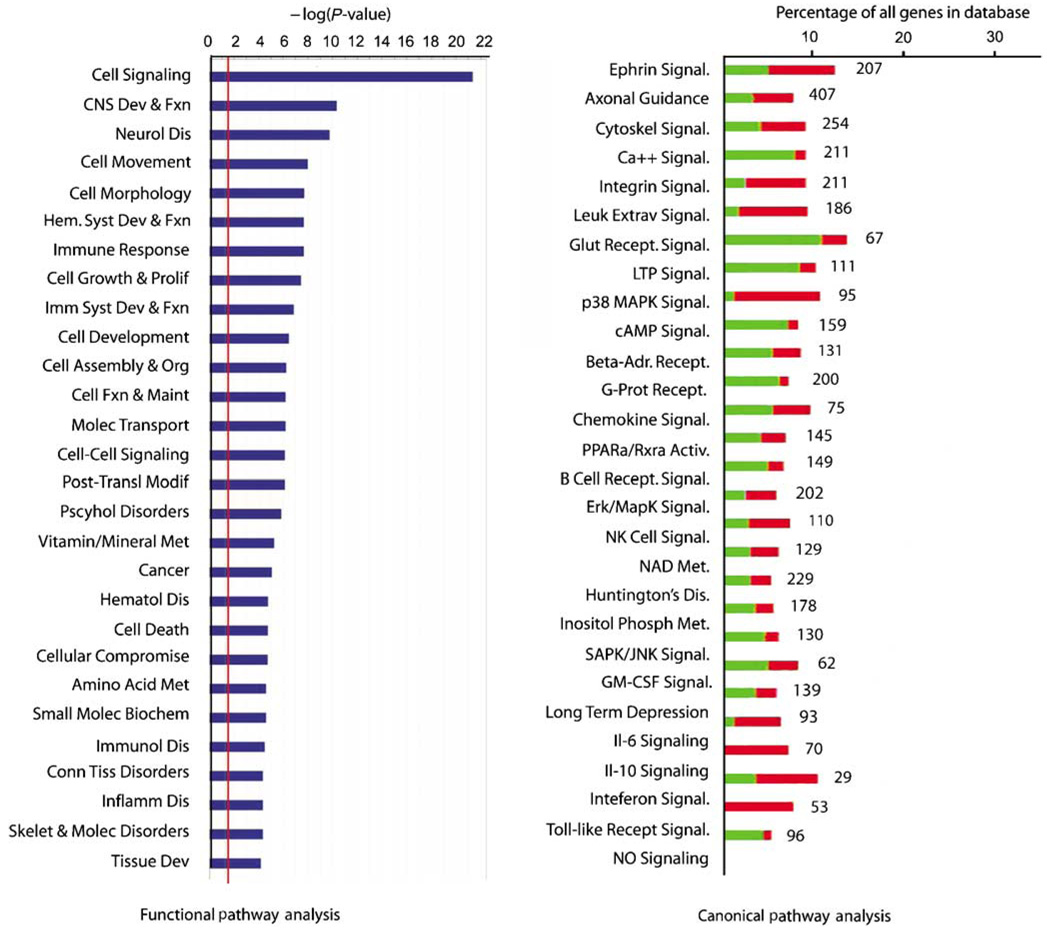
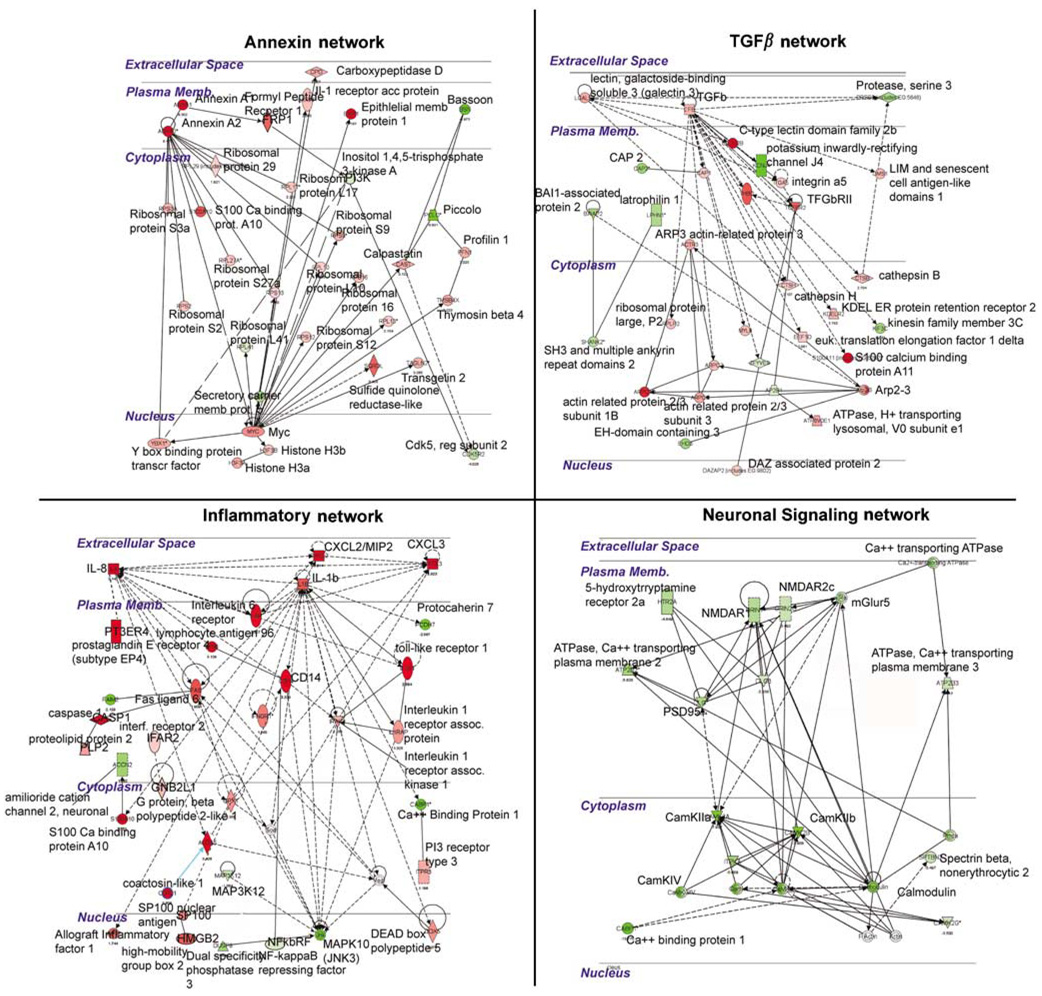
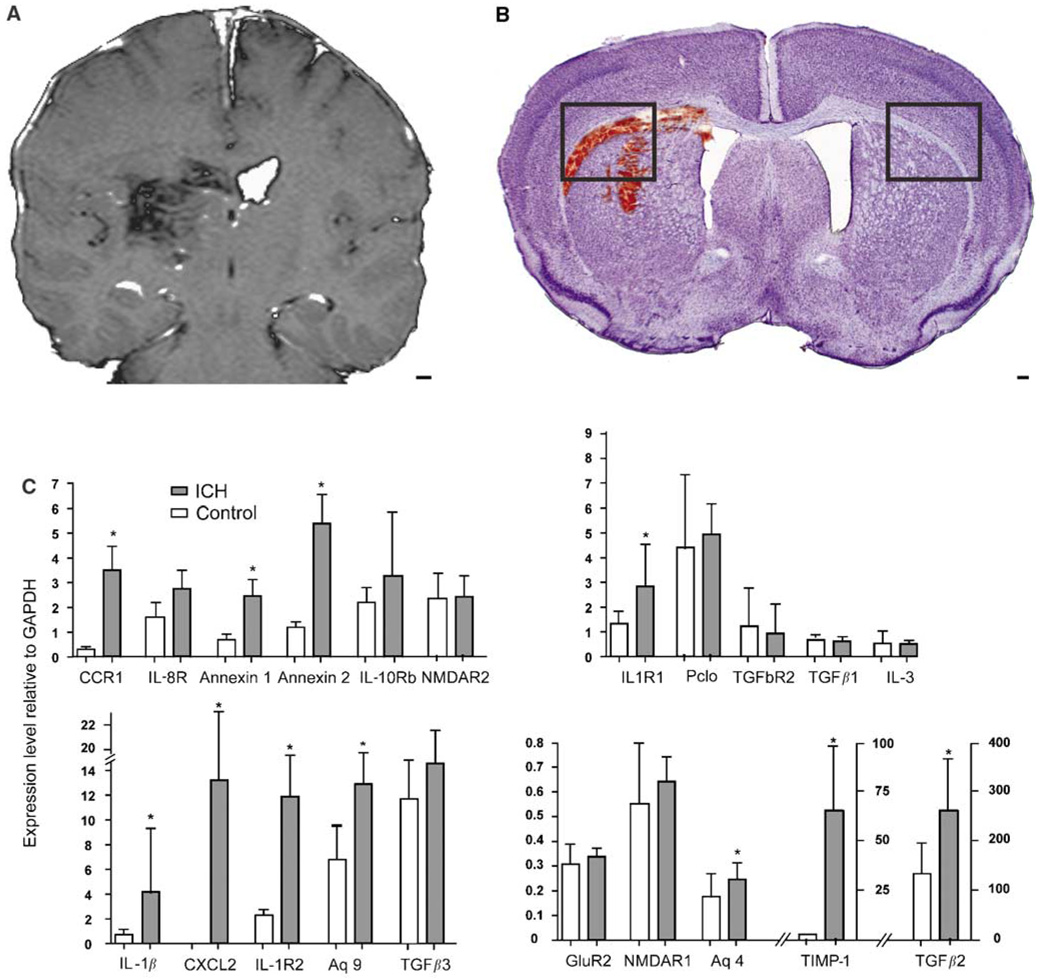
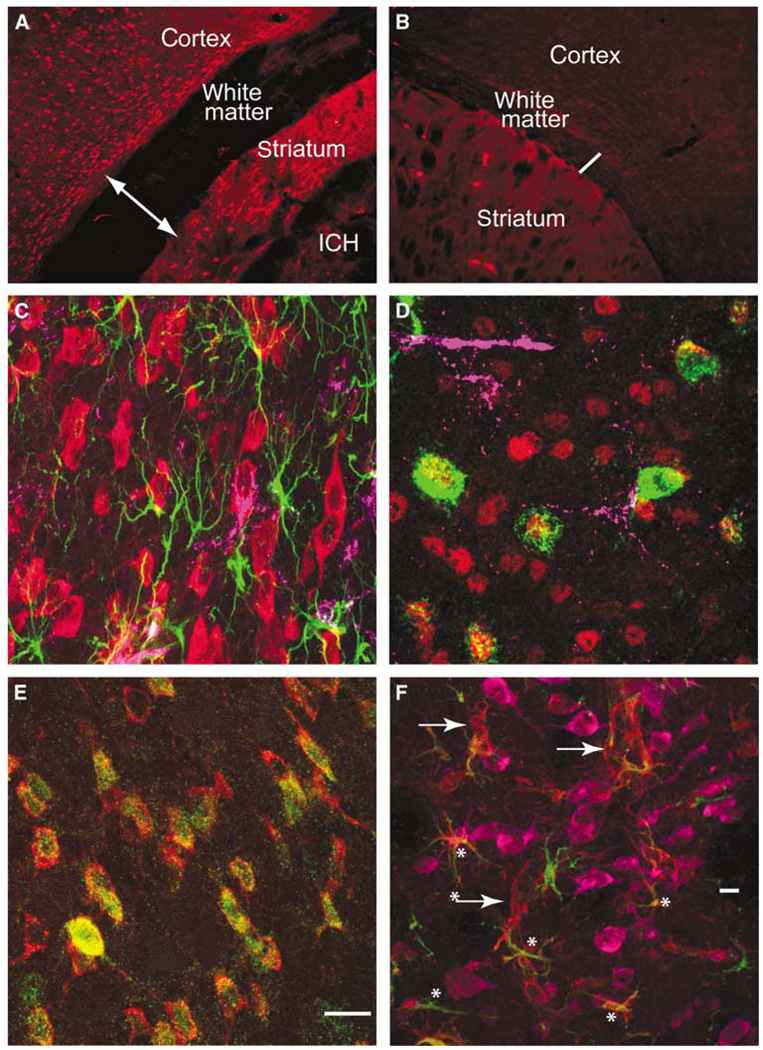
Intracerebral hemorrhage (ICH) produces a high rate of death and disability. The molecular mechanisms of damage in perihematomal tissue in humans have not been systematically characterized. This study determines the gene expression profile and molecular networks that are induced in human perihematomal tissue through molecular analysis of tissue obtained from endoscopic clot evacuation. Differentially expressed genes and their cellular origin were confirmed in a mouse model of ICH. A total of 624 genes showed altered regulation in human ICH. Bioinformatic analysis shows that these genes form interconnected networks of proinflammatory, anti-inflammatory, and neuronal signaling cascades. Intracerebral hemorrhage evokes coordinated upregulation of proinflammatory signaling through specific cytokines and chemokines and their downstream molecular pathways. Anti-inflammatory networks are also induced by ICH, including annexins A1 and A2 and transforming growth factor beta (TGFbeta) and their intracellular cascades. Intracerebral hemorrhage downregulates many neuronal signaling systems, including the N-methyl-D-aspartic acid (NMDA) receptor complex and membrane ion channels. Select portions of these molecular networks were confirmed in the mouse, and the proteins in a subset of these networks localized to subsets of neurons, oligodendrocytes, or leukocytes. These inflammatory and anti-inflammatory networks interact at several key points in neutrophil signaling, apoptotic cell death, and protease responses, and indicate that secondary damage in ICH activates opposing molecular systems.


Conflict of interest statement

Conflict of interest

The authors state no conflict of interest.

Figures

Figure 1
Figure 1
Microarray analysis of human perihematomal brain samples. (A) Standard deviation of array signals across control and experimental cases after RMA normalization. Lines in each column indicate mean and boxes indicated 2 standard deviations. Red boxes are U133a arrays; green are U133plus arrays. See Table 1 for×axis abbreviations. (B) Scatter plot of the significance of expression of all genes in perihematomal tissue versus control. Y axis is the B score, a statistic derived from Bayesian analysis that reflects the probability of being differentially expressed. Red dots are genes that are significantly expressed in perihematomal versus control, having a B score ≥1.5 (C). Array clustering according to the 1,000 most highly differentially expressed genes. The colors represent a ‘heat map’ and show the MAD (median absolute deviation) score for each array relative to each other array in the entire group. The color key for the MAD score is in the top left. A lower MAD score indicates less difference between arrays in the matrix, and a red score indicates a greater statistical difference in gene expression between arrays.
Figure 2
Figure 2
Functional grouping of differentially expressed genes. The red line in the left graph indicates the threshold for a significant association, the −log(0.05). The right plot shows the percentage of genes within a canonical signaling pathway that are differentially regulated by ICH versus the total number of genes in the database for that pathway. Green indicates the number that is downregulated; red is upregulated. The number at the right of the column indicates the total number of genes for that category in the database. All of the association in the canonical signaling pathway are significant (Fisher’s exact t-test): the probability of finding the number of genes listed for each pathway as regulated in ICH out of all of the genes in the database for that pathway is greater than 0.05 for each class.
Figure 3
Figure 3
Molecular networks regulated by ICH in perihematomal tissue. Each quadrant shows a network of interacting genes and gene products whose expression is differentially regulated in response to ICH. Genes colored red are upregulated; genes colored green are downregulated. Solid lines depict a direct physical interaction between two proteins, such as annexin A1 directly binding the formyl peptide receptor 1. Dotted lines indicate an indirect interaction, such as an alteration in expression levels, posttranslational modification, or changes in protein localization.
Figure 4
Figure 4
Mouse ICH model and qRT-PCT testing of differentially regulated genes in human perihematomal tissue. (A) T1-weighted MRI image of human ICH case, HS6 (Table 1). (B) Nissl photomicrograph of mouse ICH model. Boxes in mouse ICH model indicate regions shown in Figures 5A and 5B. Note that the human ICH image has been contrast-enhanced to highlight the location of the hemorrhage. (C) Quantitative reverse-transcription polymerase chain reaction (qRT-PCR) results of differentially regulated genes in mouse perihematomal tissue based on human microarray experiments. *P≤0.05. Scale bar =3 mm (A); 100 µm (B).
Figure 5
Figure 5
Cellular pattern of annexins and inflammatory cells in perihematomal tissue. Annexin A2 immunoreactivity in the cortex, white matter, and striatum adjacent to ICH (A) and in the contralateral hemisphere (B). The area shown is indicated in the two boxes in Figure 3. Line in panel A is through edematous white matter and is 380 µm across, as compared with the line in through the contralateral white matter, which is 130 µm. (C) Cortex adjacent to hemorrhage stained for annexin A2 (red), GFAP (green), and CD68 (purple). (D) Perihematomal cortex stained for annexin A1 (green), NeuN (red), and CD68 purple. Many annexin A1-positive cells also stain for NeuN. (E) Annexin A1 (green) and A2 (red) staining in same cells in the perihematomal striatum. (F) Tissue inhibitor of metallproteinase 1 (TIMP-1, red), NeuN (purple), and GFAP (green) immunoreactivity in perihematomal tissue. Tissue inhibitor of metallproteinase 1 is present in neurons and astrocytes (asterisks) and cells with the appearance of endothelial cells (arrows). All neurons stained for TMP1 and NeuN, rendering the composite color a red/purple. Scale bar = 15 µm in panel E corresponds to panels C to E. Scale bar = 60 µm (E).
Figure 6
Figure 6
Cellular Expression Pattern of Aquaporin 9, CCR1, and IL1R1 expression in perihematomal tissue. (A) Aquaporin 9 (red) and GFAP (green) immunostaining in periinfarct tissue. Colocalized staining is seen as yellow (asterisks). (B) GFAP (green), IL1R1 (red), and CD68 (purple) immunohistochemical staining in the perihematomal cortex. Arrows denote double labeling of CD68 and IL1R1. The inset in the bottom right is an enlargement of the bottom left corner of this panel showing overlap of staining of IL1R1 and CD68. (C) Low-power photomicrograph of CAII immunoreactivity in the perihematomal white matter and striatum. CAII is a maker for oligodendrocytes. (D) Same tissue stained for CCR1. Asterisk denotes region of hemorrhage. Area depicted in panel A is in the same region as in Figure 5A. (E) Perihematomal tissue stained for CCR1 (green), GFAP (red), and NeuN (purple). Arrows show CCR1-positive chains of cells in subcortical white matter. (F) CCR1 (red) and CAII (oligodendrocyte marker) (green) in perihematomal white matter. Note cell body colocalization of these two immunomarkers. Scale bar in panel C = 60 µm also applies to panel D. Scale bar = 10 µm in panel F and applies to panels B, E, and F.

References

    1. Aarts M, Liu Y, Liu L, Besshoh S, Arundine M, Gurd JW, Wang YT, Salter MW, Tymianski M. Treatment of ischemic brain damage by perturbing NMDA receptor-PSD–95 protein interactions. Science. 2002;298:846–850. - PubMed
    1. Ardizzone TD, Lu A, Wagner KR, Tang Y, Ran R, Sharp FR. Glutamate receptor blockade attenuates glucose hypermetabolism in perihematomal brain after experimental intracerebral hemorrhage in rat. Stroke. 2004;35:2587–2591. - PubMed
    1. Bajetto A, Bonavia R, Barbero S, Pirani P, Florio T, Schettini G. Chemokines and their receptors in the central nervous system. Front Neuroendocrinol. 2001;22:147–184. - PubMed
    1. Buisson A, Lesne S, Docagne F, Ali C, Nicole O, MacKenzie ET, Vivien D. Transforming growth factor-beta and ischemic brain injury. Cell Mol Neurobiol. 2003;23:539–550. - PMC - PubMed
    1. Cahoy JD, Emery B, Kaushal A, Foo LC, Zamanian JL, Christopherson KS, Xing Y, Lubischer JL, Krieg PA, Krupenko SA, Thompson WJ, Barres BA. A transcriptome database for astrocytes, neurons, and oligodendrocytes: a new resource for understanding brain development and function. J Neurosci. 2008;28:264–278. - PMC - PubMed

Publication types

MeSH terms

LinkOut - more resources