. 2008 Jul 16;3(7):e2732.
doi: 10.1371/journal.pone.0002732.

Genistein-supplemented diet decreases malaria liver infection in mice and constitutes a potential prophylactic strategy

Affiliations

Genistein-supplemented diet decreases malaria liver infection in mice and constitutes a potential prophylactic strategy

Margarida Cunha-Rodrigues et al. PLoS One. .

Abstract

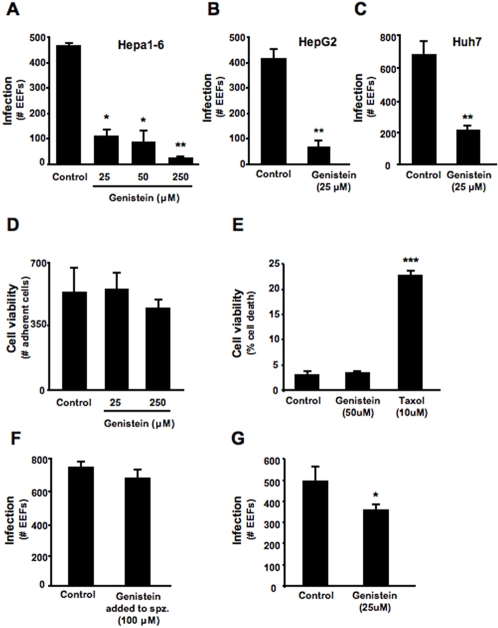
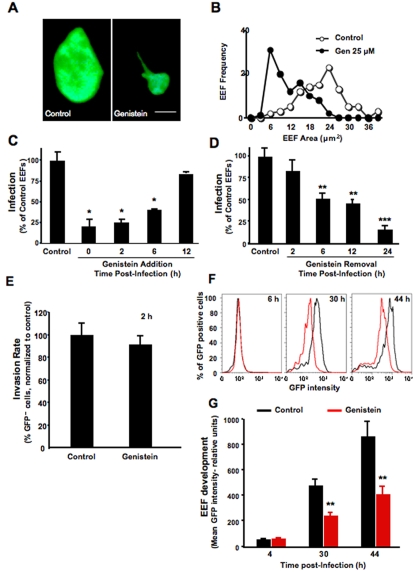
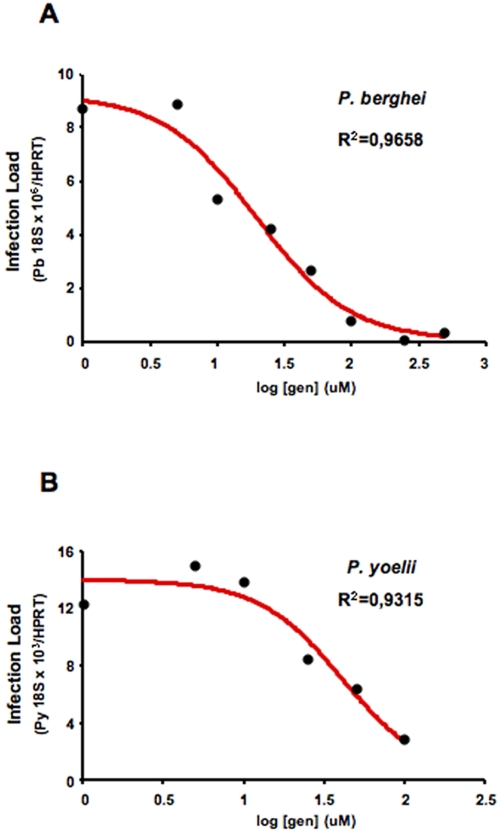
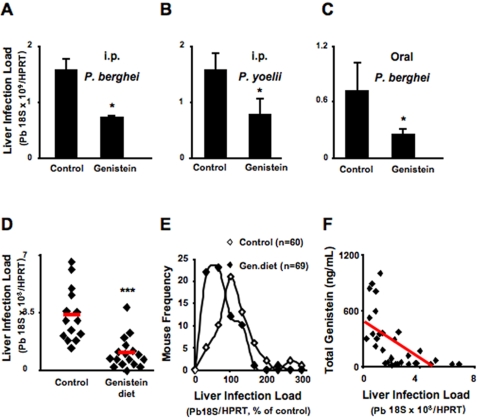
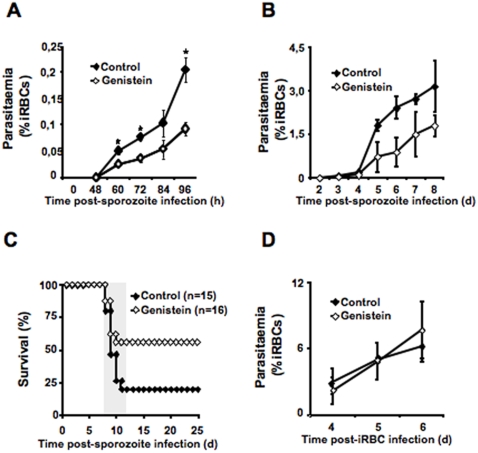
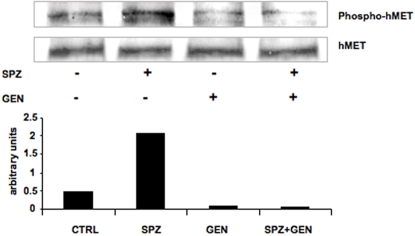
In tropical regions millions of people still live at risk of malaria infection. Indeed the emergence of resistance to chloroquine and other drugs in use in these areas reinforces the need to implement alternative prophylactic strategies. Genistein is a naturally occurring compound that is widely used as a food supplement and is thought to be effective in countering several pathologies. Results presented here show that genistein inhibits liver infection by the Plasmodium parasite, the causative agent of malaria. In vitro, genistein decreased the infection rates of both mouse and human hepatoma cells by inhibiting the early stages of the parasite's intracellular development. Oral or intraperitoneal administration of genistein decreased the liver parasite load of P. berghei-infected mice. Moreover, mice fed on a genistein-supplemented diet showed a significant reduction in Plasmodium liver infection as well as a reduced blood parasitemia and partial protection from severe disease. Since genistein is a safe, low-cost, natural compound that can be used permanently in a diet, we propose its use as a prophylactic agent against malaria for endemic populations and long-time travelers.


Conflict of interest statement

Competing Interests: The authors have declared that no competing interests exist.

Figures

Figure 1
Figure 1. Genistein inhibits in vitro hepatoma cell infection by Plasmodium sporozoites.
Cultured Hepa1-6 cells were incubated with increasing doses of genistein (A) and cultured HepG2 and Huh7 cells were incubated with 25 μM of genistein (B) and (C). As control, cells were treated with equivalent volumes of DMSO as in the genistein treated groups. The number of infected cells was determined 24 hours after infection with 4×10⁴ P. berghei ANKA sporozoites and is shown as the total number of EEFs in each coverslip. Each condition was assayed in duplicate in (A) or triplicate in (B) and (C). ★ p<0.05, ★★ p<0.01 (TTest relative to control group). Bar plot shows one representative of 3 independent experiments, error bars represent s.d. of mean number of EEFs in each condition. (D) Cultured HepG2 cells were incubated with different concentrations of genistein, or DMSO (control). After 24 hours the number of adherent cells in 10 microscope fields representing approximately 20% of the total area was assessed at 400× magnification. Each condition was assayed in duplicate. (E) Cultured Huh7 were incubated with Genstein or Taxol, along with their respective controls of DMSO, and allowed to grow for 24 hours. After this time both adherent and non-adherent cells were collected and incubated with propidium iodide. Percentage of death cells was quantified by flow cytometry. Bar plot shows one representative of 3 independent experiments, error bars represent s.d. of mean cell death percentage in each condition (n = 3). ★★ p<0.01 (TTest relative to control group). (F) P. berghei ANKA sporozoites were incubated with 100 μM genistein or DMSO for 30 min. Sporozoites were washed with PBS to remove genistein and used to infect cultured HepG2 cells. Infection was determined 24 hours post-infection by counting the total number of EEFs in each coverslip. Each experimental condition was assayed in triplicate. Bar plot shows one representative of 3 independent experiments. Error bars represent s.d. of mean number of EEFs in each condition (n = 3). (G) Huh7 cells were incubated with 25 μM genistein or DMSO for 2 h. Cells were then washed with PBS and fresh medium to remove genistein. P. berghei sporozoites were then added to these cells. Infection was determined 24 hours post-infection by counting the total number of EEFs in each coverslip. Each experimental condition was assayed in triplicate. Bar plot shows one representative of 3 independent experiments. Error bars represent s.d. of mean number of EEFs in each condition (n = 3).
Figure 2
Figure 2. Genistein suppresses the early development of parasites within hepatocytes.
(A) Hepa1-6 cells were incubated with genistein or DMSO and inoculated with 4×10⁴ P. berghei ANKA sporozoites. The two images show EEFs observed 24 hours after infection of control (left) or genistein-treated cells (right) at a 1000× magnification. Bar = 2.5 μm. (B) Distribution of EEFs according to size. Hepa1-6 cells were treated with genistein or DMSO (control) immediately prior to inoculation with 4×10⁴ P. berghei ANKA sporozoites and the size of 100 EEFs from different coverslips was determined 24 hours later. The figure shows the frequency of EEFs with sizes between 0 and 40 μm2. ○ control; • 25 μM genistein. P = 5.9×10 25 (TTest relative to the control group). The results are representative of 3 independent experiments. (C) Incubation of cultured HepG2 cells with 25 μM genistein or DMSO (control) at various times after addition of 4×10⁴ P. berghei ANKA sporozoites. Infection was determined 24 hours after sporozoite addition by counting the total number of EEFs per coverslip. The results are expressed as the percentage of EEFs relative to the average number of EEFs in the control samples, taken as 100%. (D) Incubation of cultured HepG2 cells with 25 μM genistein or DMSO (control) at the time of addition of 4×10⁴ P. berghei ANKA sporozoites and washed at various time-points. Infection was determined 24 hours after sporozoite addition by counting the total number of EEFs per coverslip. The results are expressed as the percentage of EEFs relative to the average number of EEFs in the control samples, taken as 100%. ★ p<0.05, ★★ p<0.01 ★★★ p<0.001 (TTest relative to control group). Bar plots show one representative of 3 independent experiments, error bars represent s.d. of mean number of EEFs in each condition (n = 3). (E) Flow cytometry analysis of the invasion rate in genistein-treated and control Huh7 cells at 2 hours after addition of 3×10⁴ PbGFP sporozoites. Bar plots show one representative of 3 independent experiments, error bars represent s.d. of mean percentage of GFP positive cells in each condition (n = 3). (F) Flow cytometry analysis of genistein-treated and control Huh7 cells at 6, 30 and 44 hours after addition of 3×10⁴ PbGFP sporozoites, and of primaquine-treated and control cells at 44 hours after adition of 3×10⁴ PbGFP sporozoites. Red line represents Genistein treated cells and black line represents control cells. The graphs show one representative dataset of triplicate samples. (G) Quantification of the GFP intensity of PbGFP-infected genistein-treated (red bars) and non-treated (black bars) cells at the same time points as in E. ★★ p<0.01 (TTest relative to control group). Bar plots show one representative of 3 independent experiments, error bars represent s.d. of mean GFP intensity in each condition (n = 3).
Figure 3
Figure 3. Genistein's 50% Inhibitory Concentration (IC50).
(A) Cultured Huh7 cells were treated with increasing doses of genistein or DMSO (control), and inoculated with 4×10⁴ P. berghei ANKA sporozoites. Infection was determined 24 hours later by parasite-specific 18S rRNA qRT PCR, and an IC50 of 20 μM was calculated for genistein's inhibition of infection. Black circles represent the mean of P. berghei ANKA18S rRNA expression in each condition (n = 3). (B) Cultured Hepa1-6 cells were treated with increasing doses of genistein or DMSO (control), and inoculated with 3.5×10⁴ P. yoelii sporozoites. Infection was determined 24 hours later by parasite-specific 18S rRNA qRT PCR, and an IC50 of 30 μM was calculated for genistein's inhibition of infection. Black circles represent the mean of P. berghei ANKA18S rRNA expression in each condition (n = 3).
Figure 4
Figure 4. Genistein decreases mouse liver lnfection by P. berghei ANKA sporozoites.
(A) Mice treated by intraperitoneal injection of 4 mg of genistein in a volume of 200μL DMSO, or with DMSO alone (control), were injected intravenously with P. berghei ANKA sporozoites (1×10⁴/mouse). Infection was determined 40 hours later by parasite-specific 18S rRNA qRT PCR (n = 4 mice per group). ★ p<0.05 (TTest relative to control group). Bar plots show one representative of 3 independent experiments. Error bars represent s.d. of mean P. berghei ANKA 18S rRNA expression in each condition (n = 3). (B) Mice treated by intraperitoneal injection of 4 mg of genistein in a volume of 200μL DMSO, or with DMSO alone (control), were injected intravenously with P. yoelii ANKA sporozoites (1×10⁴/mouse). Infection was determined 40 hours later by parasite-specific 18S rRNA qRT PCR (n = 4 mice per group). ★ p<0.05 (TTest relative to control group). Bar plots show one representative of 3 independent experiments. Error bars represent s.d. of mean P. yoelii ANKA 18S rRNA expression in each condition (n = 3). (C) Mice treatment by oral administration of 4 mg of genistein suspended in 200 μL water or with the same volume of water alone (control), 6 hours prior to intravenous injection of sporozoites (1×10⁴/mouse). Infection was determined 40 hours later by parasite-specific 18S rRNA qRT-PCR. n = 3 mice per group. ★ p<0.05 (TTest relative to control group). Bar plots show one representative of 3 independent experiments. Error bars represent s.d. of mean P. berghei ANKA 18S rRNA expression in each condition (n = 3). (D) Mice kept on a genistein-supplemented diet since breastfeeding or with the same diet without supplementation as a control, were injected intravenously with P. berghei ANKA sporozoites (1×10⁴/mouse). Infection was determined 40 hours later by parasite-specific 18S rRNA qRT-PCR. n = 14 control group; n = 17 genistein treated group. ♦ individual mouse, red bar represents the group average. P = 0.00007 (TTest relative to control group). Results are representative of 3 independent experiments. (E) Compiled data of liver infection from 5 independent experiments with mice fed on genistein-supplemented diet for a minimum of 5 weeks and injected intravenously with P. berghei ANKA sporozoites (1×10⁴/mouse). Infection was determined 40 hours later by parasite-specific 18S rRNA qRT-PCR. Results are expressed as frequency of mice that present a certain level of infection. Infection is expressed as the percentage of parasite specific 18S rRNA taking the average control (non-supplemented diet) as 100%. ⋄ control diet (n = 60), ♦ 1000 ppm genistein-supplemented diet (n = 69). P = 5.8×10 5 (Wilcoxon rank sum test to control group). (F) Inverse correlation between genistein levels in the sera and Plasmodium infection in the liver. Mice kept under genistein-supplemented diet since breastfeeding or with the same diet without supplementation, used as controls, were injected intravenously with P. berghei ANKA sporozoites (1×10⁴/mouse). Infection was determined 40 hours later by parasite-specific 18S rRNA qRT-PCR, sera were collected and genistein levels were determined for individual mice. Total genistein levels (ng/mL) in the sera are plotted against liver infection of individual mice. Infection is expressed as the percentage of parasite specific 18S rRNA taking the average control (non-supplemented diet) as 100%. ♦ represent the coordinates for genistein level (yy) and infection (xx) for individual mice. The red line represents the inverse correlation between the two parameters measured.
Figure 5
Figure 5. Genistein partially protects from cerebral malaria.
(A) Mice fed on a genistein-supplemented or control diet since breastfeeding were injected intravenously with P. berghei ANKA sporozoites (1×10⁴/mouse) and maintained for the analysis of blood infection. Peripheral blood parasitemia was determined, at different time points after infection, by counting the number of infected red blood cells in Giemsa stained thin blood films. ♦ control diet; ⋄ 1000 ppm genistein-supplemented diet, n = 3 mice per group. ★ p<0.005 (TTest relative to control group). The results are representative of 3 independent experiments with a total of 15 control mice and 19 genistein-treated mice. (B) Same as in A between day 2 and day 8 after intravenous injection of P. berghei ANKA sporozoites by counting the number of infected red blood cells in Giemsa stained thin blood films. ♦ control diet; ⋄ 1000ppm genistein-supplemented diet, n = 3 mice per group. (C) Cumulative survival of mice fed on a genistein-supplemented or control diet since breastfeeding when injected intravenously with P. berghei ANKA sporozoites (1×10⁴/mouse). Fifty-six percent of the mice fed on the genistein-supplementd diet and infected with P. berghei ANKA sporozoites are protected from developing cerebral malaria when compared with twenty percent of mice fed on the control diet. ♦ control diet, n = 15; ⋄ 1000 ppm genistein supplemented diet, n = 16. The gray area represents the time window for developing cerebral malaria in this model. P = 0.067 (Log-Rank Test). (D) Mice fed on a genistein-supplemented or control diet since breastfeeding were infected by intraperitoneal injection of 1×10⁶ P. berghei ANKA iRBC. Peripheral blood parasitemia was determined throughout infection by counting the number of infected red blood cells in Giemsa stained thin blood films. Parasitemia indicates the percentage of iRBC in a given number of total red blood cells. ♦ control diet, n = 6; ⋄ 1000 ppm genistein-supplemented diet, n = 7. Results are representative of 2 independent experiments with a total of 11 control mice and 12 genistein-treated mice.
Figure 6
Figure 6. Effect of genistein on Plasmodium sporozoite-induced MET phoshorylation.
Cultured Huh7 cells were treated with genistein or DMSO (control), and inoculated with 3×10⁴ P. berghei ANKA sporozoites. Four hours later total protein extracts were analyzed with anti-phospho c-met (Tyr1234/1235) and MET antibodies. Quantification of intensity of each band was performed and plotted on a graph.

References

    1. Prudencio M, Rodriguez A, Mota MM. The silent path to thousands of merozoites: the Plasmodium liver stage. Nat Rev Microbiol. 2006;4:849–856. - PubMed
    1. Alonso PL, Sacarlal J, Aponte JJ, Leach A, Macete E, et al. Efficacy of the RTS,S/AS02A vaccine against Plasmodium falciparum infection and disease in young African children: randomised controlled trial. Lancet. 2004;364:1411–1420. - PubMed
    1. Aponte JJ, Aide P, Renom M, Mandomando I, Bassat Q, et al. Safety of the RTS,S/AS02D candidate malaria vaccine in infants living in a highly endemic area of Mozambique: a double blind randomised controlled phase I/IIb trial. Lancet. 2007;370:1543–1551. - PubMed
    1. Akiyama T, Ishida J, Nakagawa S, Ogawara H, Watanabe S, et al. Genistein, a specific inhibitor of tyrosine-specific protein kinases. J Biol Chem. 1987;262:5592–5595. - PubMed
    1. Holzbeierlein JM, McIntosh J, Thrasher JB. The role of soy phytoestrogens in prostate cancer. Curr Opin Urol. 2005;15:17–22. - PubMed

Publication types