. 2008 Jul 16;3(7):e2721.
doi: 10.1371/journal.pone.0002721.

TAF6delta controls apoptosis and gene expression in the absence of p53

Affiliations

TAF6delta controls apoptosis and gene expression in the absence of p53

Emmanuelle Wilhelm et al. PLoS One. .

Abstract

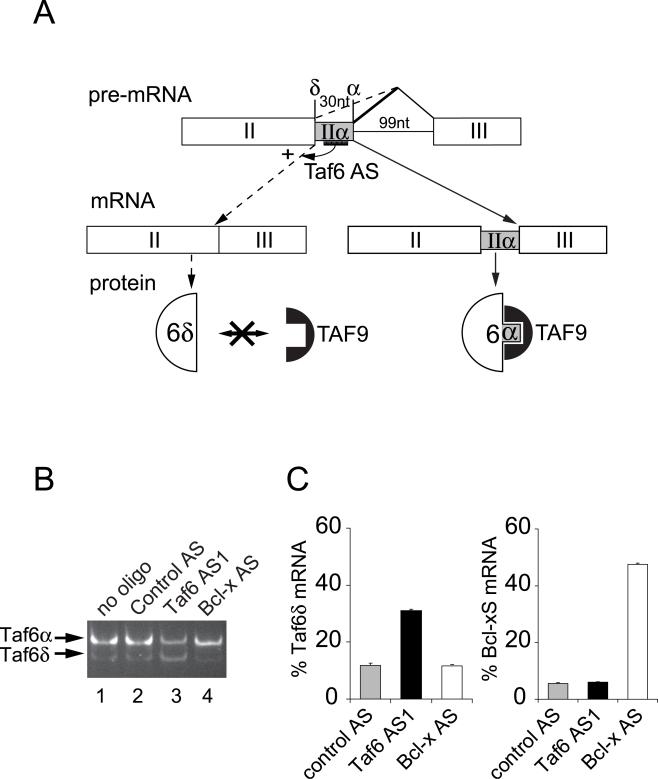
Background: Life and death decisions of metazoan cells hinge on the balance between the expression of pro- versus anti-apoptotic gene products. The general RNA polymerase II transcription factor, TFIID, plays a central role in the regulation of gene expression through its core promoter recognition and co-activator functions. The core TFIID subunit TAF6 acts in vitro as an essential co-activator of transcription for the p53 tumor suppressor protein. We previously identified a splice variant of TAF6, termed TAF6delta that can be induced during apoptosis.

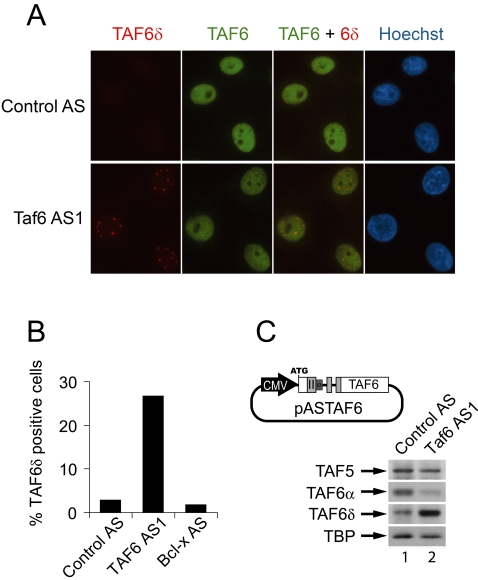
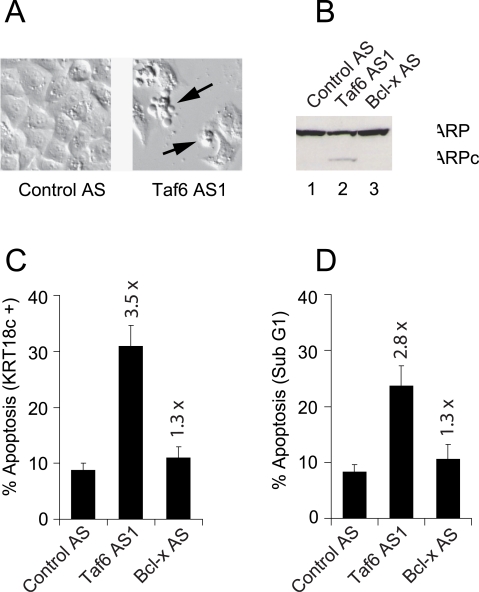
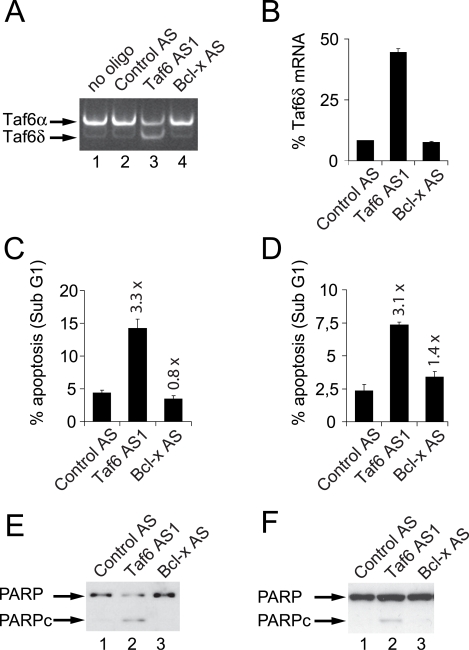
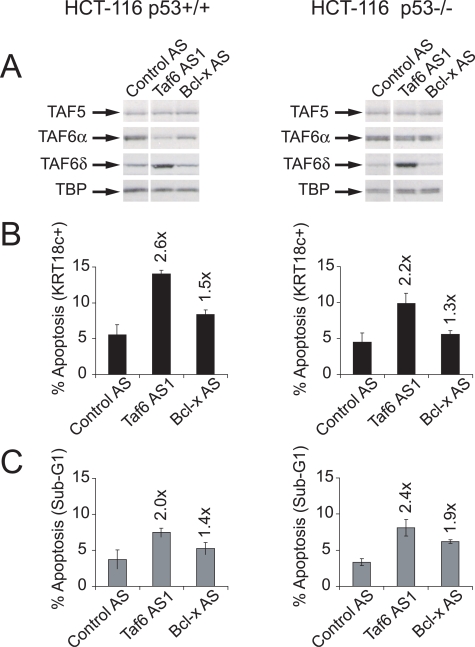
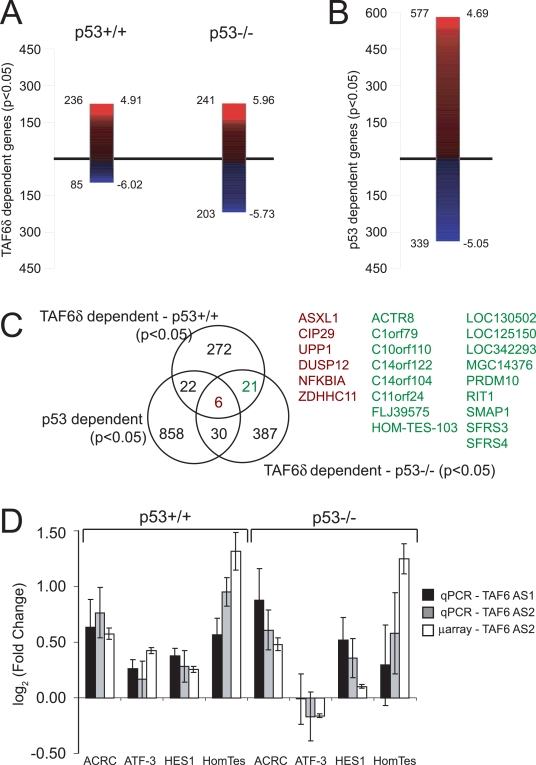
Methodology/principal findings: To elucidate the impact of TAF6delta on cell death and gene expression, we have employed modified antisense oligonucleotides to enforce expression of endogenous TAF6delta. The induction of endogenous TAF6delta triggered apoptosis in tumor cell lines, including cells devoid of p53. Microarray experiments revealed that TAF6delta activates gene expression independently of cellular p53 status.

Conclusions: Our data define TAF6delta as a pivotal node in a signaling pathway that controls gene expression programs and apoptosis in the absence of p53.


Conflict of interest statement

Competing Interests: The authors have declared that no competing interests exist.

Figures

Figure 1
Figure 1. Specific control of endogenous TAF6 alternative splicing by modified antisense RNA oligonucleotides in living cells.
(A) The region of the TAF6 pre-mRNA that includes two alternative 5′ splice sites (SSs) that produce either the constitutive α splice variant or the alternative δ splice variant is schematically depicted. Selection of an intron-proximal α 5′ splice site (SS) results in production of the α isoform of TAF6 (at right) whereas the selection of the proximal δ 5′ SS results in the production of the δ isoform (at left). The SSOs that base pair with the alternative exon forces splicing from the distal 5′ SS and induces expression of the endogenous TAF6δ isoform (at left). The protein produced by the major splice variant, TAF6α, can interact with the TFIID subunit, TAF9 via its histone fold domain. In contrast, TAF6δ lacks 10 amino acids of helix 2 of its histone fold motif and therefore cannot interact with TAF9. (B) Antisense RNA oligonucleotides induce endogenous TAF6δ mRNA expression. HeLa cells were transfected with 200 nM oligonucleotides directed against: the alternative exon II (exon IIα) of the TAF6 gene (Taf6 AS1), the Bcl-x gene (Bcl-x AS), or a scrambled control oligonucleotide (Control AS). 24 hours post-transfection total RNA was isolated and subjected to RT-PCR with primers that amplify both the TAF6α and the alternative TAF6δ mRNAs. (C) Specificity of TAF6 splice site switching oligonucleotides. HeLa cells were transfected with antisense RNA oligonucleotides as in A. RT-PCR was perfomed with primers sets that amplify the both the α and δ TAF6 splice variants, or both the Bcl-xS and Bcl-xL splice variants. PCR products were separated by microfluidity and analyzed using a 2100 Agilent bioanalyzer. The ratio of TAF6δ mRNA over total TAF6 mRNA and the ratio of Bcl-Xs mRNA over total Bcl-X mRNA are expressed on the y-axis. The values from cells treated with scrambled control (grey bars), Taf6 AS1 (black bars), or Bcl-X AS (white bars) are shown. Error bars represent the standard deviation of three independent transfections.
Figure 2
Figure 2. Specific induction of TAF6δ protein expression by modified antisense RNA oligonucleotides.
(A) HeLa cells were transfected with splice site-switching oligonucleotides directed against exon IIα of the TAF6 gene and treated with MG-132 5 hours later. 21 hours post transfection cells were fixed and stained with the indicated antibodies for immunocytochemistry (B) Quantification of endogenous TAF6δ expressing cells transfected with splice site-switching antisense oligonucleotides. Results are expressed as the percentage of cells displaying a clear TAF6δ punctate staining on a total of at least 500 cells. (C) Translation of exogenous TAF6δ is induced by modified antisense RNA oligonucleotides. Schematic representation of plasmid pASTAF6 containing sequences derived from the TAF6 cDNA (white) or from genomic DNA (grey). HeLa cells were first transfected with pASTAF6 and 19 hours later with splice site switching oligonucleotides and treated with MG132 and ZVAD-FMK 6 hours after this second transfection. 38 hours post-transfection protein extracts from cells were analyzed by immunoblotting with monoclonal antibodies directed against TFIID subunits.
Figure 3
Figure 3. Expression of endogenous TAF6δ causes cell death by apoptosis.
HeLa cells were transfected with antisense oligonucleotides that induce endogenous TAF6δ (Taf6 AS1), scrambled control oligonucleotides (Control AS), or oligonucleotides that induce endogenous Bcl-xS expression (Bcl-x AS). (A) 24 hours post transfection cells were observed by differential interference contrast microscopy. (B) Proteins were extracted from transfected cells and subjected to immunoblot analysis with anti-PARP monoclonal antibodies. PARPc indicates caspase cleaved PARP. (C) The percentage of apoptotic cells was analyzed by flow cytometry using monoclonal antibodies that detect caspase cleaved cytokeratin-18. (D) The percentage of apoptotic cells was analyzed by flow cytometry to detect sub G1 DNA content. The values indicated above the data bars are the fold induction of apoptosis with respect to Control oligonucleotide-treated cells.
Figure 4
Figure 4. TAF6δ induces apoptosis in cancer cell lines lacking p53.
Saos-2 human bone osteosarcoma cells, that do not express p53, were transfected with antisense oligonucleotides that induce endogenous TAF6δ (Taf6 AS1), scrambled control oligonucleotides (Control AS), or oligonucleotides that induce endogenous Bcl-xS expression (Bcl-x AS). (A) 24 hours post transfection total RNA was isolated for analysis by RT-PCR with primers that amplify both the TAF6α and TAF6δ mRNAs. (B) RT-PCR products were analyzed on an Agilent Bioanalyzer. Error bars indicate the standard deviation of three independent transfections. (C) Percentage of apoptotic Saos-2 cells was analyzed by flow cytometry to detect sub G1 DNA content. Error bars indicate the standard deviation of three independent transfections. (D) As in C except that A549 human lung carcinoma cells, that express wild-type p53, were transfected. (E) As in C except that proteins were extracted from transfected Saos-2 cells and subjected to immunoblot analysis with anti-PARP monoclonal antibodies. PARPc indicates caspase cleaved PARP. (F) As in E except with A549 cells.
Figure 5
Figure 5. p53 is dispensable for TAF6δ-induced apoptosis.
(A) Western blot analysis of TFIID subunits following TAF6 and Bcl-x SSO in HCT-116 p53 +/+ (left panels) and HCT-116 p53 −/− cells (right panels). HCT-116 cells were transfected first with plasmid pASTAF6 (see Fig. 2C) and 19 hours later with antisense oligonucleotides that induce endogenous TAF6δ (Taf6 AS1), scrambled control oligonucleotides (Control AS), or oligonucleotides that induce endogenous Bcl-xS expression (Bcl-x AS). Total cells extracts were prepared and separated on 10% SDS-PAGE, followed by immunoblotting with anti-TFIID subunit antibodies as indicated with arrows. (B) The percentage of apoptotic cells was analyzed by flow cytometry using monoclonal antibodies that detect caspase cleaved cytokeratin-18. (C) The percentage of apoptotic cells was analyzed by flow cytometry to detect sub G1 DNA content. The values indicated above the data bars are the fold induction of apoptosis with respect to Control oligonucleotide-treated cells. Error bars indicate the standard deviation of three independent transfections.
Figure 6
Figure 6. Endogenous TAF6δ expression induces apoptosis in the absence of p53.
(A) Transcriptome analysis following TAF6 SSO in HCT-116 p53+/+ and p53−/− cells. Expression levels of mRNAs from cells treated with oligonucleotide Taf6AS2 were individually compared to control oligonucleotide-treated HCT-116 samples by genome-wide microarray analysis. The absolute number of probes detecting statistically significant (p<0.05) up- or down-regulation following splice-site selection is shown to the left of each bar; the maximum positive or negative logarithmic (base two) fold-change is shown to the right. The red gradient indicates positive, and the blue gradient negative fold changes in expression. (B) Transcriptome analysis following TAF6 SSO in HCT-116 cells and selecting for those genes that show significant regulation between the HCT-116 p53 +/+ versus HCT-116 p53 −/− cells irrespective of TAF6δ expression. Labels as in (A). (C) Venn-Diagram displaying the overlap between the three different target gene repertoires shown in (A) and (B). (D) Verification of gene expression changes by quantitative real-time RT-PCR. HCT-116 p53+/+ and HCT-116 p53−/− cells were transfected with two distinct antisense oligonucleotides that induce endogenous TAF6δ; Taf6 AS1 (grey bars), Taf6 AS2 (black bars). White bars indicate values from microarray experiments for comparison. 18 hours post-transfection total RNA was extracted and the levels of the indicated mRNAs were analyzed by quantitative real-time PCR with respect to the levels from cells treated with the control oligonucleotide. Error bars indicate standard deviation of three independent transfections.

References

    1. Hengartner MO. The biochemistry of apoptosis. Nature. 2000;407:770–776. - PubMed
    1. Thompson CB. Apoptosis in the pathogenesis and treatment of disease. Science. 1995;267:1456–1462. - PubMed
    1. Fesus L. Inducible gene expression in apoptosis [In Process Citation]. Cell Death Differ. 1999;6:1144–1145. - PubMed
    1. Kumar S, Cakouros D. Transcriptional control of the core cell-death machinery. Trends Biochem Sci. 2004;29:193–199. - PubMed
    1. Schwerk C, Schulze-Osthoff K. Regulation of apoptosis by alternative pre-mRNA splicing. Mol Cell. 2005;19:1–13. - PubMed

Publication types