. 2008 Jul 16;3(7):e2722.
doi: 10.1371/journal.pone.0002722.

Global regulation of nucleotide biosynthetic genes by c-Myc

Affiliations

Global regulation of nucleotide biosynthetic genes by c-Myc

Yen-Chun Liu et al. PLoS One. .

Abstract

Background: The c-Myc transcription factor is a master regulator and integrates cell proliferation, cell growth and metabolism through activating thousands of target genes. Our identification of direct c-Myc target genes by chromatin immunoprecipitation (ChIP) coupled with pair-end ditag sequencing analysis (ChIP-PET) revealed that nucleotide metabolic genes are enriched among c-Myc targets, but the role of Myc in regulating nucleotide metabolic genes has not been comprehensively delineated.

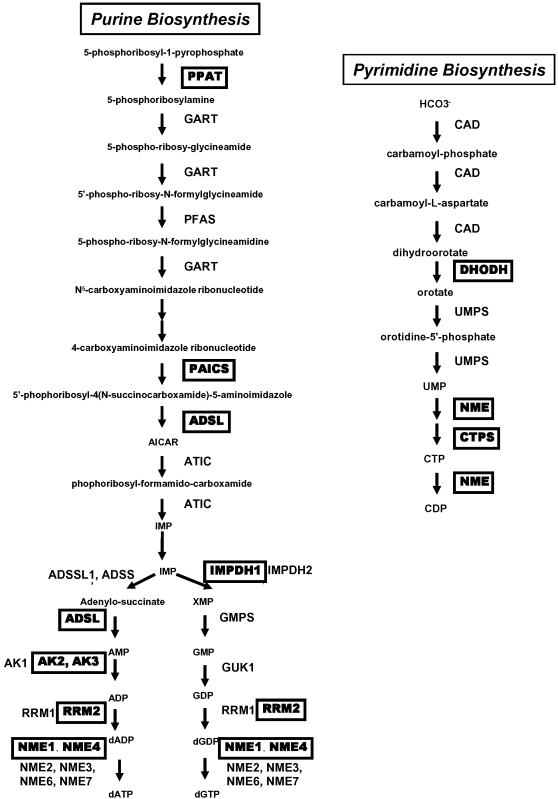
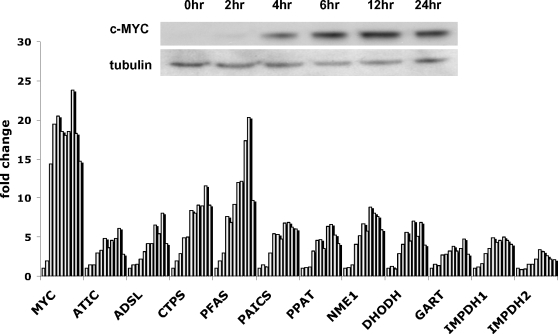
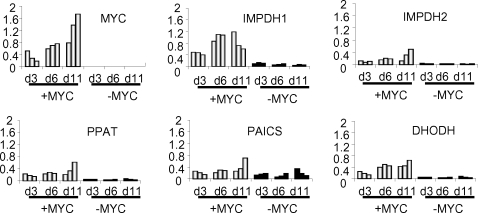
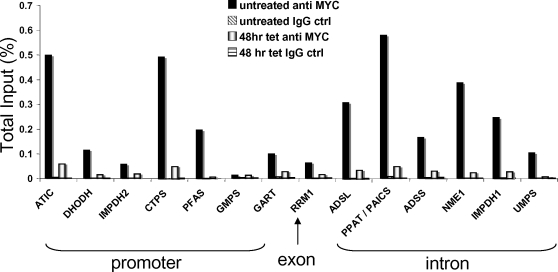
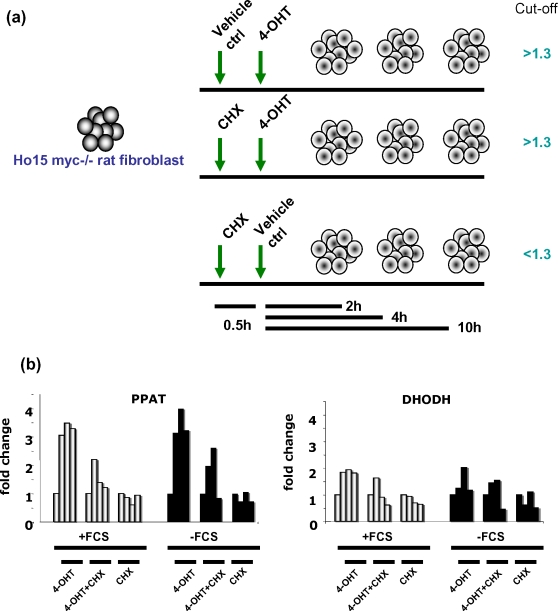
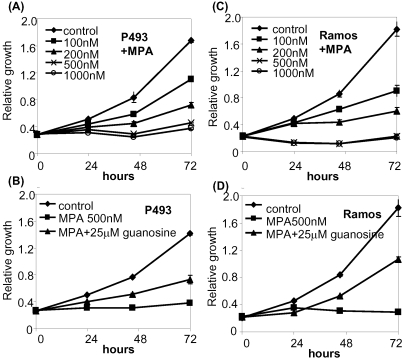
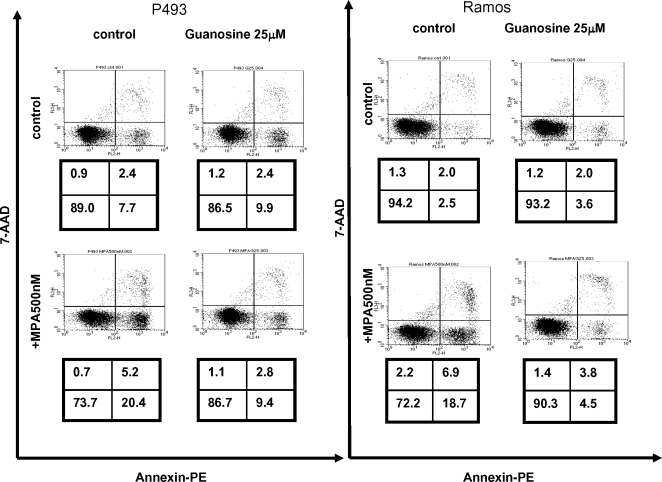
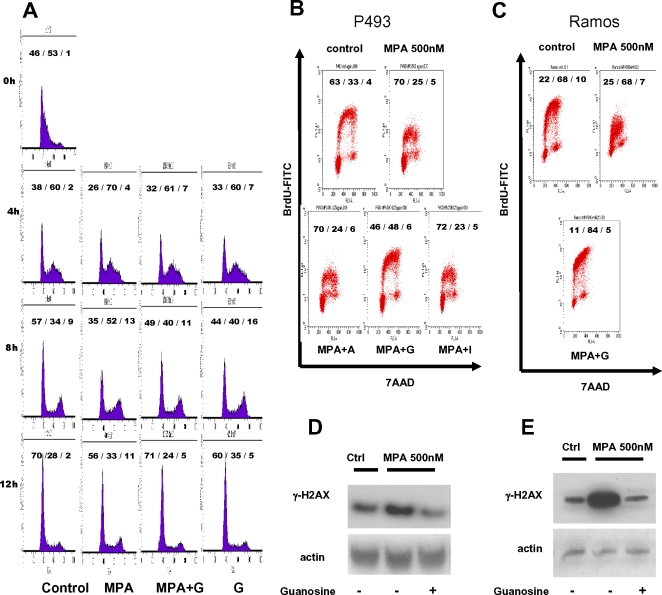
Methodology/principal findings: Here, we report that the majority of genes in human purine and pyrimidine biosynthesis pathway were induced and directly bound by c-Myc in the P493-6 human Burkitt's lymphoma model cell line. The majority of these genes were also responsive to the ligand-activated Myc-estrogen receptor fusion protein, Myc-ER, in a Myc null rat fibroblast cell line, HO.15 MYC-ER. Furthermore, these targets are also responsive to Myc activation in transgenic mouse livers in vivo. To determine the functional significance of c-Myc regulation of nucleotide metabolism, we sought to determine the effect of loss of function of direct Myc targets inosine monophosphate dehydrogenases (IMPDH1 and IMPDH2) on c-Myc-induced cell growth and proliferation. In this regard, we used a specific IMPDH inhibitor mycophenolic acid (MPA) and found that MPA dramatically inhibits c-Myc-induced P493-6 cell proliferation through S-phase arrest and apoptosis.

Conclusions/significance: Taken together, these results demonstrate the direct induction of nucleotide metabolic genes by c-Myc in multiple systems. Our finding of an S-phase arrest in cells with diminished IMPDH activity suggests that nucleotide pool balance is essential for c-Myc's orchestration of DNA replication, such that uncoupling of these two processes create DNA replication stress and apoptosis.


Conflict of interest statement

Competing Interests: The authors have declared that no competing interests exist.

Figures

Figure 1
Figure 1. Purine and pyrimidine biosynthesis pathways.
The inset provides a legend of nucleotide metabolism genes with direct MYC binding found by ChIP-PET in P493-6 model .
Figure 2
Figure 2. Nucleotide biosynthetic genes are responsive to MYC induction in human B cells in vitro.
The expression of the nucleotide synthetic genes is temporally responsive to Myc induction. The inset shows an immunoblot of Myc expression in P493-6 cells withdrawn from tetracycline. Bar graphs represent mRNA expression of each indicated nucleotide synthetic gene relative to 18S rRNA control as determined by triplicate real-time PCR reactions (with less than 5% error from the mean) in P493-6 cells with a time course after tetracycline withdrawal (0, 2, 4, 6, 8, 10, 12, 16, 24, 32 and 48hrs after tetracycline removal). MYC was used as a positive control. MAX mRNA level was not found to be affected by MYC induction in P493 cells (not shown).
Figure 3
Figure 3. The expression of selected key nucleotide synthesis genes is responsive to MYC in hepatocytes in vivo.
LAP-tTA X TRE-Myc transgenic mouse conditionally expresses MYC proto-oncogene in hepatocytes. Male littermates withdrawn from doxycycline at birth overexpressed MYC. Littermates withdrawn from doxycycline remained tumor-free up to day 3 (d3) but all developed liver tumors by day 11 (d11). Newborn mice continuously treated with doxycycline remained free of disease. In both groups (with or without doxycycline treatment), 3 mice were sacrificed at each time point (d3, d6, and d11) and the RNA extract from each liver sample was subjected to real-time PCR analysis for the expression of key genes. Bar graphs represent mRNA expression of human MYC and each nucleotide biosynthetic enzyme gene in the pathway relative to 18S rRNA control.
Figure 4
Figure 4. MYC binds to the regulatory regions of de novo nucleotide synthetic genes in B cells.
Chromatin immunoprecipitation assay demonstrates direct Myc binding to the nucleotide synthesis genes in P493-6 cells. Chromatin from P493-6 cells with or without tetracycline treatment for 48 hours were precipitated with either anti-Myc or control IgG as indicated. The promoter or intronic sequence of each gene was quantitatively amplified by real-time PCR. Bar graphs represent Myc binding to chromatin regions that contain promoters (ATIC, CTPS, DHODH, GART, GMPS, IMPDH2, and PFAS), exons (RRM1) or introns (ADSL, ADSS, IMPDH1, NME1, PPAT/PAICS, and UMPS). Note that PPAT and PAICS are shown together because they share a bidirectional promoter. Significant binding is >0.02% total input.
Figure 5
Figure 5. PPAT and DHODH are direct c-MYC target genes in the HO.15 MYC-ER system.
(A) The experiment design was shown in the diagram. We set the following criteria to identify direct MYC target genes: 1) A>1.3 fold induction of expression by 4-OHT with or without cycloheximide; 2) A<1.3 fold induction of expression by cycloheximide alone. (B) PPAT and DHODH fulfilled the criteria in the majority of the experiments. Bar graphs represent mRNA expression of either PPAT or DHODH relative to 18S rRNA control as determined by real-time PCR in HO.15 MYC-ER cells with regular medium (+FCS; light bars represent the expression at 0, 2, 4,10 hr) or with serum starvation (-FCS; black bars represent the expression at 0, 2, 4,10 hr). One representative experiment is shown for each group from 4 biologically independent experiments.
Figure 6
Figure 6. Mycophenolic acid (MPA) inhibits proliferation in P493-6 cells (left panels) and Ramos human Burkitt's lymphoma cell line (right panels).
Cell proliferation was analyzed by using colorimetric microplate assay in which tetrazolium salt was bioreduced to orange product. Y-axis represents the absorbance measurement at 450 nm. Error bars represent standard deviations derived from three independent measurements. (A) Growth rates of P493-6 cells at different concentrations of MPA. (B) Growth rates of MPA-treated P493-6 cells with guanosine supplement. (C) Growth rates of Ramos cells at different concentration of MPA. (D) Growth rates of MPA-treated Ramos cells with guanosine supplement.
Figure 7
Figure 7. Mycophenolic acid (MPA) induces apoptosis in P493-6 and Ramos cells.
Cells with designated treatments were subjected to annexin V staining with 7-AAD and flow cytometry after 48 hours. Cells in the lower right quadrant, which are annexin-positive but 7-AAD-negative, represent the apoptotic population. Necrotic or late apoptotic cells are 7-AAD-positive. The number indicates the percentage of the cells in each quadrant.
Figure 8
Figure 8. Mycophenolic acid (MPA) slows DNA replication in P493-6 cells.
(A) P493-6 cells were synchronized with double thymidine block. Cells were incubated with 2mM thymidine for 12 hours, washed and incubated with normal growth medium for another 12 hours, and underwent a second thymidine treatment for 12 hours. After washing, cells were subsequently treated with either methanol vehicle or MPA and guanosine as indicated. Cells were collected for cell cycle profile analysis at different time points (4 h, 8 h, and 12 h) after release from double thymidine block. Cell cycle profiles were analyzed by flow cytometry using PI staining. Numbers indicate the percentage of the cells in each cell cycle phase (G1/S/G2M). (B) DNA replication and cell cycle profile were examined by BrdU uptake assay. P493-6 cells were pulsed with BrdU for 30 minutes before fixation and subsequent staining. Anti-BrdU FITC antibody was used for measuring the BrdU incorporation. DNA content was assessed with 7-AAD staining. MPA-treated cells were incubated concurrently with the indicated nucleotide (A = 25 µM adenosine; G = 25 µM guanosine; I = 25 µM inosine) supplement for 48 hrs before subjected to the analysis. (C) BrdU uptake assay in Ramos cells treated with MPA or with both MPA and 25 µM guanosine(G). Cells were processed as described in Panel 8B. (D) Immunoblot demonstrating the expression of γ-H2AX, a marker for DNA double strand breaks, in MPA-treated P493-6 cells. Protein lysates from cells with designated conditions were harvested 48 hrs after guanosine treatment. In the groups receiving both MPA and guanosine supplement, the treatment started concurrently. (E) γ−H2AX expression in MPA-treated Ramos cells with or without 25 µM guanosine.

References

    1. Hecht JL, Aster JC. Molecular biology of Burkitt's lymphoma. J Clin Oncol. 2000;18:3707–3721. - PubMed
    1. Liao DJ, Dickson RB. c-Myc in breast cancer. Endocr Relat Cancer. 2000;7:143–164. - PubMed
    1. Nesbit CE, Tersak JM, Prochownik EV. MYC oncogenes and human neoplastic disease. Oncogene. 1999;18:3004–3016. - PubMed
    1. Zeller KI, Jegga AG, Aronow BJ, O'Donnell KA, Dang CV. An integrated database of genes responsive to the Myc oncogenic transcription factor: identification of direct genomic targets. Genome Biol. 2003;4:R69. - PMC - PubMed
    1. Cory S, Harris AW, Langdon WY, Alexander WS, Corcoran LM, et al. The myc oncogene and lymphoid neoplasia: from translocations to transgenic mice. Hamatol Bluttransfus. 1987;31:248–251. - PubMed

Publication types