

Reduction of elevated blood lead levels in children in North Carolina and Vermont, 1996-1999
- PMID: 18629325
- PMCID: PMC2453171
- DOI: 10.1289/ehp.10548
Reduction of elevated blood lead levels in children in North Carolina and Vermont, 1996-1999
Abstract
Background: Few studies have examined factors related to the time required for children's blood lead levels (BLLs) > or = 10 microg/dL to decline to < 10 microg/dL.
Objectives: We used routinely collected surveillance data to determine the length of time and risk factors associated with reducing elevated BLLs in children below the level of concern of 10 microg/dL.
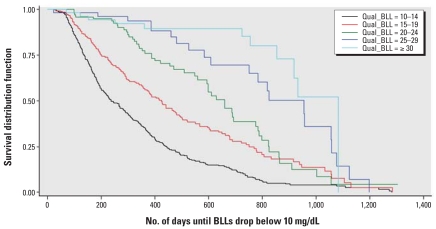
Methods: From the North Carolina and Vermont state surveillance databases, we identified a retrospective cohort of 996 children < 6 years of age whose first two blood lead tests produced levels > or = 10 microg/dL during 1996-1999. Data were stratified into five categories of qualifying BLLs and analyzed using Cox regression. Survival curves were used to describe the time until BLLs declined below the level of concern. We compared three different analytic methods to account for children lost to follow-up.
Results: On average, it required slightly more than 1 year (382 days) for a child's BLL to decline to < 10 microg/dL, with the highest BLLs taking even longer. The BLLs of black children [hazard ratio (HR) = 0.84; 95% confidence interval (CI), 0.71-0.99], males (HR(male) = 0.83; 95% CI, 0.71-0.98), and children from rural areas (HR(rural) = 0.83; 95% CI, 0.70-0.97) took longer to fall below 10 microg/dL than those of other children, after controlling for qualifying BLL and other covariates. Sensitivity analysis demonstrated that including censored children estimated a longer time for BLL reduction than when using linear interpolation or when excluding censored children.
Conclusion: Children with high confirmatory BLLs, black children, males, and children from rural areas may need additional attention during case management to expedite their BLL reduction time to < 10 microg/dL. Analytic methods that do not account for loss to follow-up may underestimate the time it takes for BLLs to fall below the recommended target level.
Keywords: blood lead level; capillary; chelation; children; surveillance; venous.
Figures
References
-
- Agency for Toxic Substances and Disease Registry. Toxicological Profile for Lead. Atlanta, GA: Agency for Toxic Substances and Disease Registry; 2005.
-
- Anderson MK, Amrich M, Decker KL, Mervis CA. Using state lead poisoning surveillance system data to assess false positive results of capillary testing. Matern Child Health J. 2007;11(6):603–610. - PubMed
-
- Baghurst PA, Tong SL, McMichael AJ, Robertson EF, Wigg NR, Vimpani GV. Determinants of blood lead concentrations to age 5 years in a birth cohort study of children living in the lead smelting city of Port Pirie and surrounding areas. Arch Environ Health. 1992;47:203–210. - PubMed
-
- Bellinger D, Sloman J, Leviton A, Rabinowitz M, Needleman HL, Waternaux C. Low-level lead exposure and children’s cognitive function in the preschool years. Pediatrics. 1991;87:219–227. - PubMed
-
- CDC. Preventing Lead Poisoning in Young Children. Atlanta, GA: Centers for Disease Control and Prevention; 1991.
MeSH terms
LinkOut - more resources
Full Text Sources
Medical
