

Resonance Raman characterization of the peroxo and hydroperoxo intermediates in cytochrome P450
- PMID: 18630867
- PMCID: PMC3120136
- DOI: 10.1021/jp8017875
Resonance Raman characterization of the peroxo and hydroperoxo intermediates in cytochrome P450
Abstract
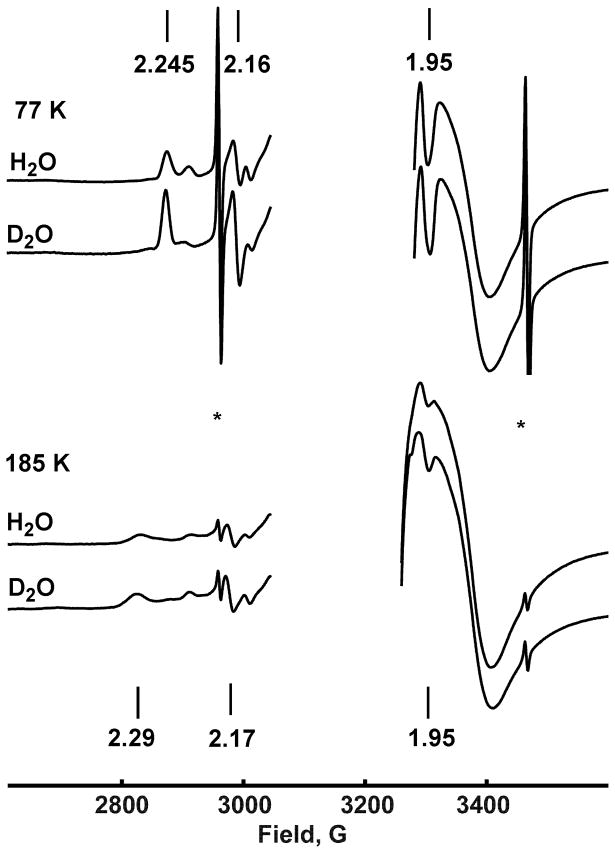
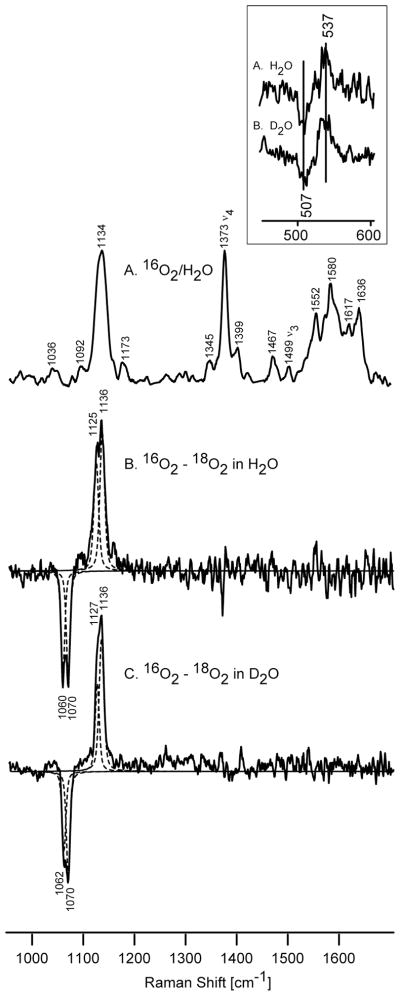
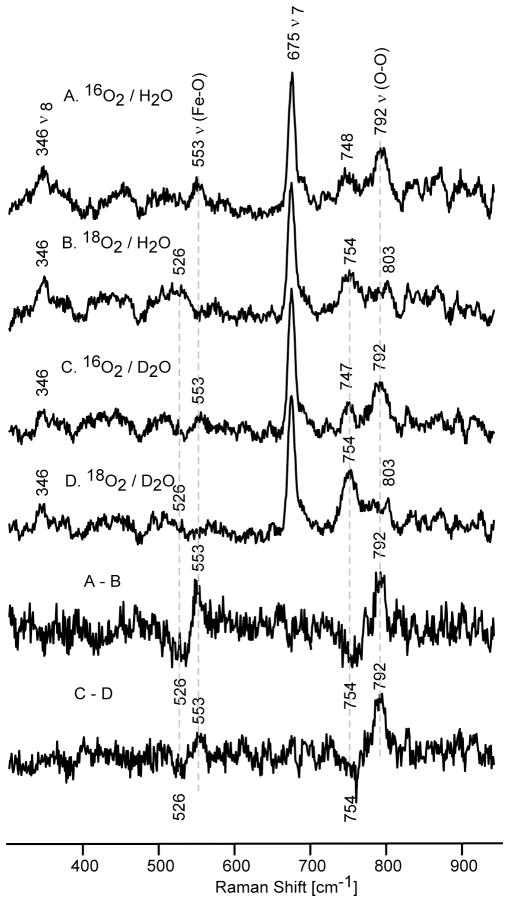
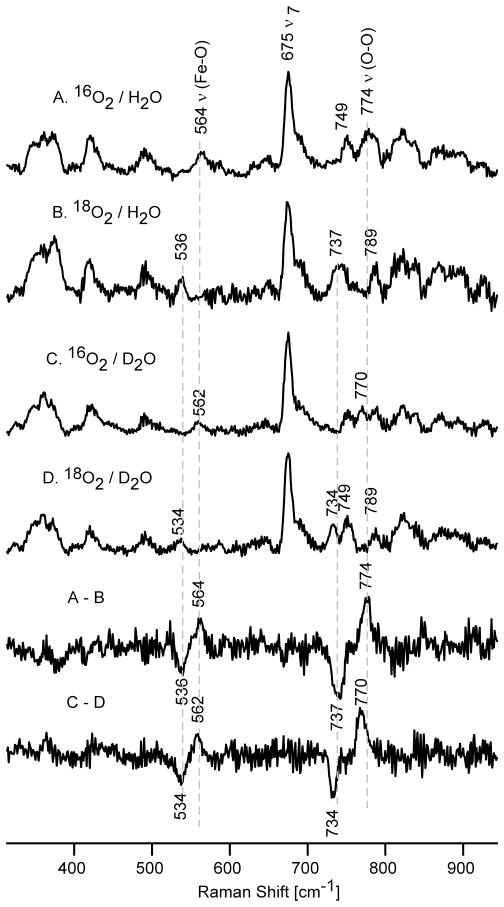
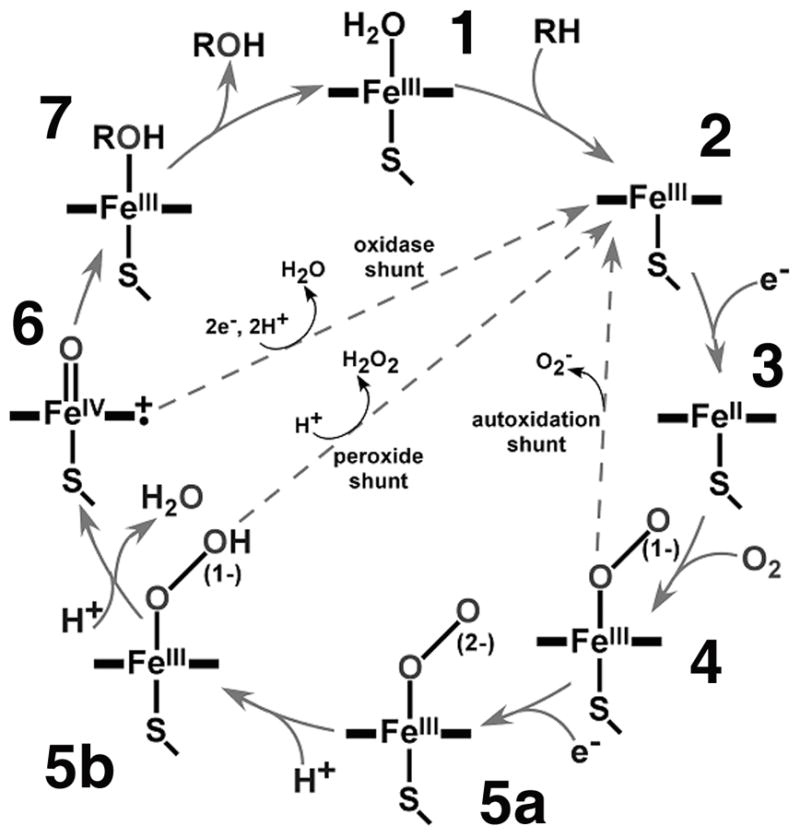
Resonance Raman (RR) studies of intermediates generated by cryoreduction of the oxyferrous complex of the D251N mutant of cytochrome P450(cam) (CYP101) are reported. Owing to the fact that proton delivery to the active site is hindered in this mutant, the unprotonated peroxo-ferric intermediate is observed as the primary species after radiolytic reduction of the oxy-complex in frozen solutions at 77 K. In as much as previous EPR and ENDOR studies have shown that annealing of this species to approximately 180 K results in protonation of the distal oxygen atom to form the hydroperoxo intermediate, this system has been exploited to permit direct RR interrogation of the changes in the Fe-O and O-O bonds caused by the reduction and subsequent protonation. Our results show that the nu(O-O) mode decreases from a superoxo-like frequency near approximately 1130 cm(-1) to 792 cm(-1) upon reduction. The latter frequency, as well as its lack of sensitivity to H/D exchange, is consistent with heme-bound peroxide formulation. This species also exhibits a nu(Fe-O) mode, the 553 cm(-1) frequency of which is higher than that observed for the nonreduced oxy P450 precursor (537 cm(-1)), implying a strengthened Fe-O linkage upon reduction. Upon subsequent protonation, the resulting Fe-O-OH fragment exhibits a lowered nu(O-O) mode at 774 cm(-1), whereas the nu(Fe-O) increases to 564 cm(-1). Both modes exhibit a downshift upon H/D exchange, as expected for a hydroperoxo-ferric formulation. These experimental RR data are compared with those previously acquired for the wild-type protein, and the shifts observed upon reduction and subsequent protonation are discussed with reference to theoretical predictions.
Figures
References
-
- Makris TM, Davydov R, Denisov IG, Hoffman BM, Sligar SG. Drug Metab Rev. 2002;34:691–708. - PubMed
-
- Makris TM, Denisov IG, Schlichting I, Sligar SG. Activation of Molecular Oxygen by Cytochrome P450. In: Ortiz de Montellano PR, editor. Cytochrome P450: Structure, Function, Genetics. 3. Kluwer Academic/Plenum Publishers; New York: 2005. pp. 149–182.
-
- Denisov IG, Makris TM, Sligar SG, Schlichting I. Chem Rev. 2005;105:2253–2277. - PubMed
-
- Que L, Jr, Ho RYN. Chem Rev. 1996;96:2607–2624. - PubMed
-
- Bukowski MR, Halfen HL, van den Berg TA, Halfen JA, Que L., Jr Angew Chemie, Int Ed. 2005;44:584–587. - PubMed
Publication types
MeSH terms
Substances
Grants and funding
LinkOut - more resources
Full Text Sources
Research Materials
