

doi: 10.1021/pr800154p.
Epub 2008 Jul 17.
DirecTag: accurate sequence tags from peptide MS/MS through statistical scoring
Affiliations
- PMID: 18630943
- PMCID: PMC2810657
- DOI: 10.1021/pr800154p
Item in Clipboard
DirecTag: accurate sequence tags from peptide MS/MS through statistical scoring
J Proteome Res.
2008 Sep.
Abstract
In shotgun proteomics, tandem mass spectra of peptides are typically identified through database search algorithms such as Sequest. We have developed DirecTag, an open-source algorithm to infer partial sequence tags directly from observed fragment ions. This algorithm is unique in its implementation of three separate scoring systems to evaluate each tag on the basis of peak intensity, m/ z fidelity, and complementarity. In data sets from several types of mass spectrometers, DirecTag reproducibly exceeded the accuracy and speed of InsPecT and GutenTag, two previously published algorithms for this purpose. The source code and binaries for DirecTag are available from http://fenchurch.mc.vanderbilt.edu.
Figures
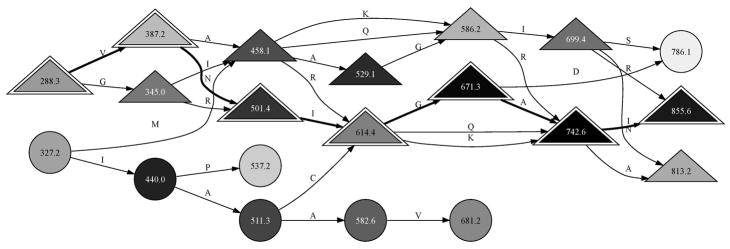
A spectrum may be viewed as a graph for tag inference. This graph represents the MS/MS observed for the peptide DAGTIAGLNVLR. Each major peak in the spectrum is shown as a node, with the most intense peaks given the darkest shading. When peaks are separated by the mass of an amino acid, they are joined by an edge labeled with the amino acid symbol. Complemented peaks are denoted by triangles. The 3-letter sequence tags for this spectrum are sequences of four connected nodes. DirecTag was configured to retain the top 100 peaks for each spectrum, yielding graphs with far more possible tags than shown here. The true sequence of this peptide can be reconstructed from a path of ions stretching from 288.3 to 855.6 m/z (indicated by outlined triangles). It is reversed with respect to m/z order because the fragments are y ions.
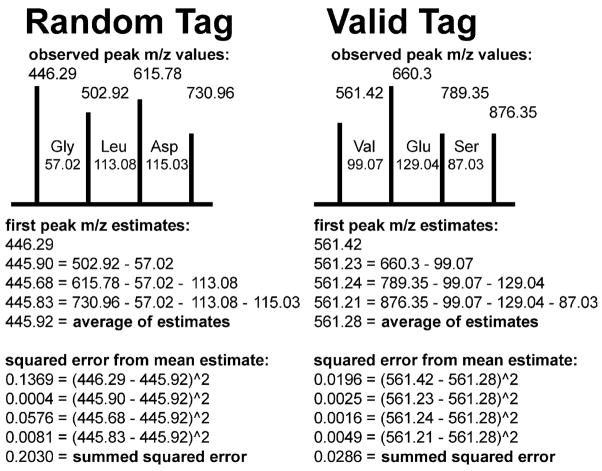
m/z fidelity for a tag can be characterized through SSE. DirecTag evaluates the consistency of fragment ion m/z values for each tag. The gap defined by each pair of fragment ions in a valid tag will be close to an amino acid mass. In a random collection of peaks, though, the gap masses will have random differences from amino acid masses. This computation yields a summed squared error (SSE) to reflect the fidelity of the peak m/z spacings.
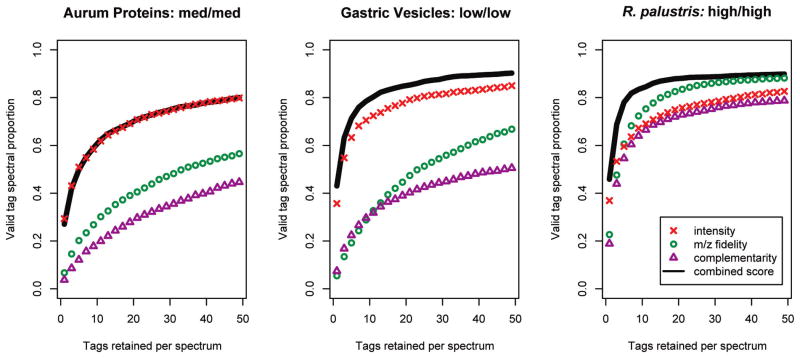
Three subscores contribute to DirecTag scoring accuracy. Tests on data sets of three different mass accuracies revealed different discrimination in DirecTag’s three subscores. The spectra used in these tests had been successfully identified by database search. The curves reflect the fraction of these spectra for which a valid tag was generated by DirecTag. When more tags were retained for each spectrum, DirecTag succeeded on a larger proportion of spectra. The best discrimination, however, pushes valid tags to the best ranks, making it possible to retain fewer tags per spectrum. Combining the three subscores performed better than any single subscore in almost all cases. The mass accuracy of precursor and fragment ions is shown after the sample name for each panel.
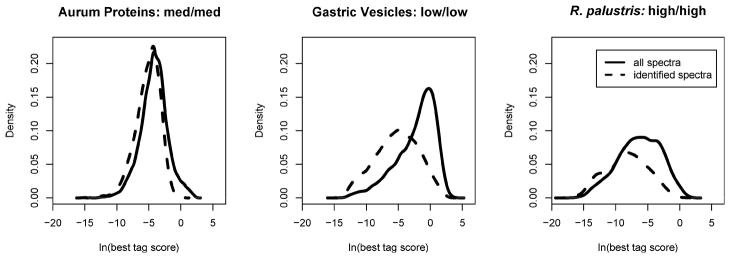
The best tag scores for identifiable spectra are better than those of other spectra. These three density plots examine the best tag scores observed for each spectrum. Each score is expressed as an expectation value, so the distributions evaluate the natural logarithms of the scores. “Identified spectra” are those for which the MyriMatch score exceeded the highest-scoring reversed peptide in the set. The differences between these distributions suggest that tag scores may be used to quality filter spectra prior to identification.
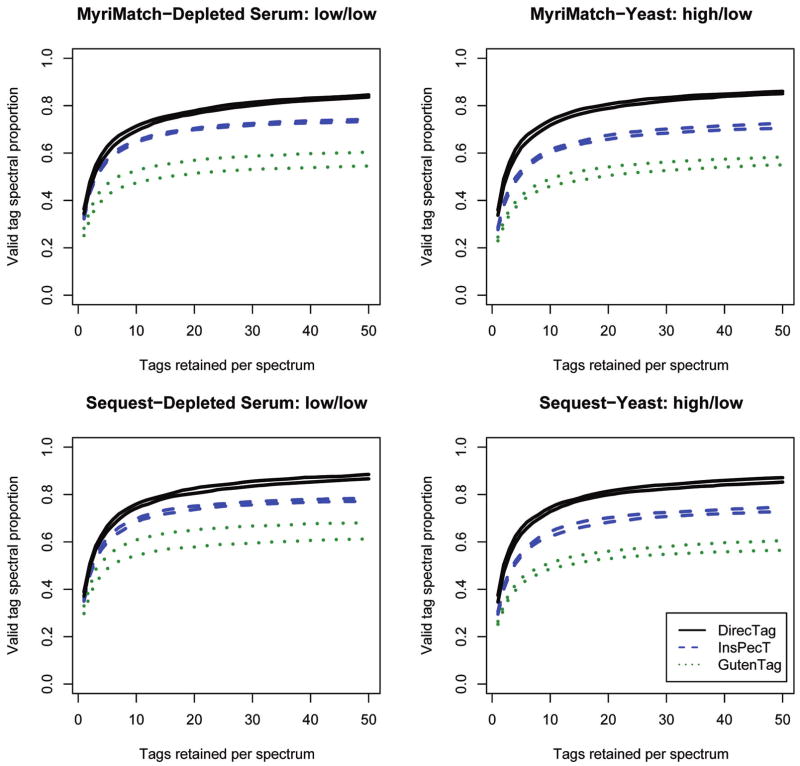
Tagging accuracy for DirecTag, InsPecT, and GutenTag. Replicate RPLC separations of serum and yeast were analyzed on a Thermo LTQ or LTQ Orbitrap, respectively. In “high/low,” the first word describes the precursor mass accuracy and the second word describes the fragment ion mass accuracy. Identifications were generated from these sets by MyriMatch and Sequest, and the spectra were processed through three sequence tag generation tools. These graphs show the fraction of confidently identified spectra that produce valid tags from each of the three tools. An ideal sequence tagger is one that can produce valid tags for a large proportion of identifiable spectra (i.e., have the highest curve) and then rank those valid tags at the top of the list (i.e., produce a curve that rises more quickly). The two traces for each algorithm describe the interquartile performance across the replicates; the higher shows the 75%ile performance, and the lower shows the 25%ile performance.
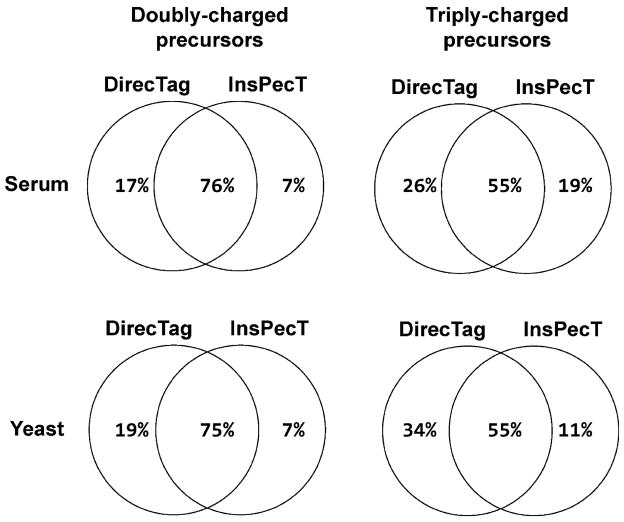
Overlapping performance for DirecTag and InsPecT. These Venn diagrams describe the overlap in spectra with valid tags. The precursor ion charge was a better predictor of overlap than the instrument that produced the spectra. These two algorithms were more similar in spectra from doubly charged precursors than in spectra from triply charged precursors.
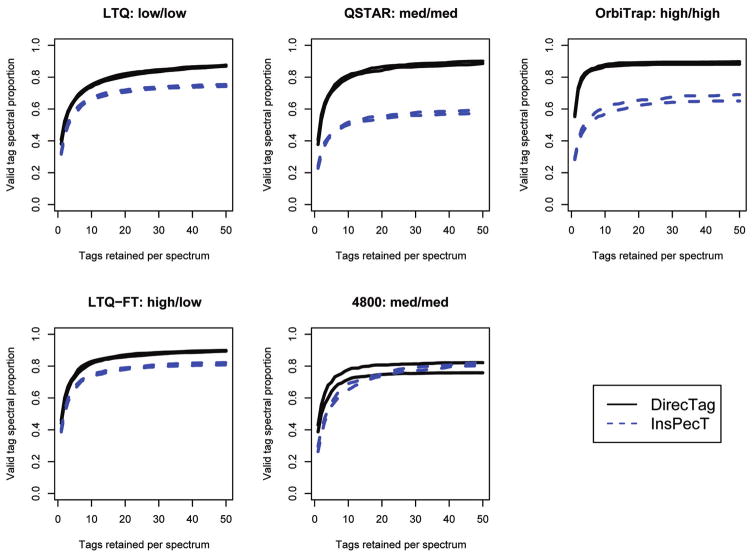
DirecTag and InsPecT compared on multiple instruments. These curves compare tagging performance for a defined mixture on a variety of instruments. In each case, the distance between the two curves for each instrument reflects the interquartile consistency of tag inference. Mass accuracy for each instrument is summarized as high, medium, or low, with precursor mass accuracy described first and fragment ion mass accuracy described second. In each case, the tag inference accuracy achieved by DirecTag was superior to that observed for InsPecT.
References
-
- Yates JR, III, Eng JK, McCormack AL, Schieltz D. Method to correlate tandem mass spectra of modified peptides to amino acid sequences in the protein database. Anal Chem. 1995;67(8):1426–1436. - PubMed
-
- Sadygov RG, Yates JR., III A hypergeometric probability model for protein identification and validation using tandem mass spectral data and protein sequence databases. Anal Chem. 2003;75(15):3792–3798. - PubMed
-
- Geer LY, Markey SP, Kowalak JA, Wagner L, Xu M, Maynard DM, Yang X, Shi W, Bryant SH. Open mass spectrometry search algorithm. J Proteome Res. 2004;3(5):958–964. - PubMed
-
- Zhang N, Aebersold R, Schwikowski B. ProbID: a probabilistic algorithm to identify peptides through sequence database searching using tandem mass spectral data. Proteomics. 2002;2(10):1406–1412. - PubMed
-
- Fenyo D, Beavis RC. A method for assessing the statistical significance of mass spectrometry-based protein identifications using general scoring schemes. Anal Chem. 2003;75(4):768–774. - PubMed
Publication types
MeSH terms
Substances
Grants and funding
LinkOut - more resources
Full Text Sources
Other Literature Sources
