. 2008 Aug;69(4):1054-68.
doi: 10.1111/j.1365-2958.2008.06346.x. Epub 2008 Jul 9.

Two essential MYST-family proteins display distinct roles in histone H4K10 acetylation and telomeric silencing in trypanosomes

Affiliations

Two essential MYST-family proteins display distinct roles in histone H4K10 acetylation and telomeric silencing in trypanosomes

Taemi Kawahara et al. Mol Microbiol. 2008 Aug.

Abstract

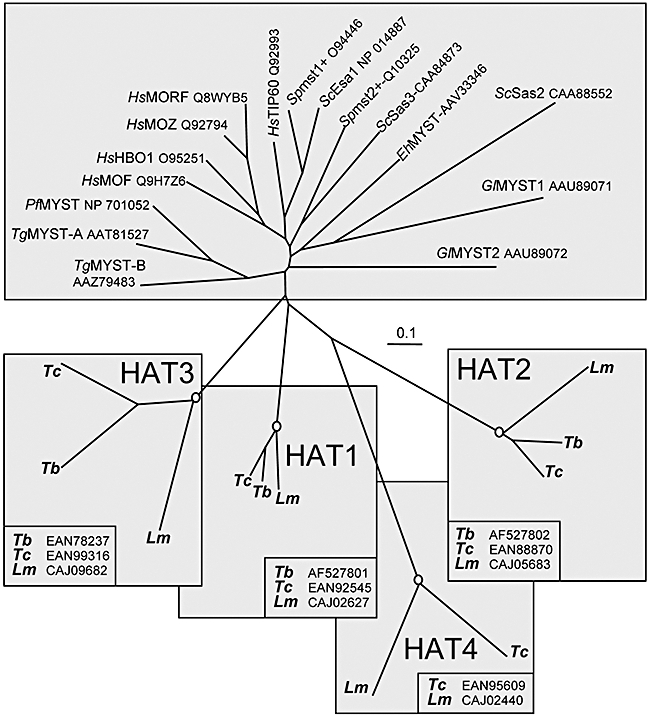
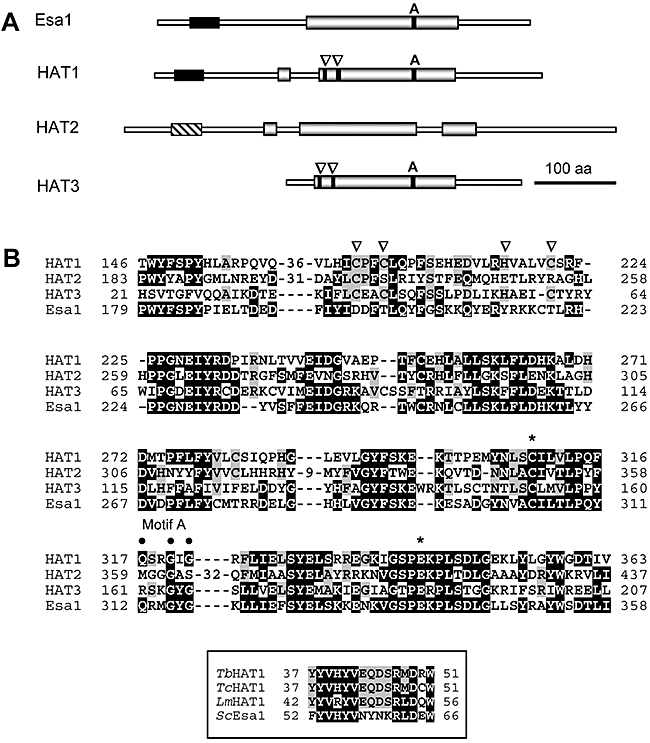
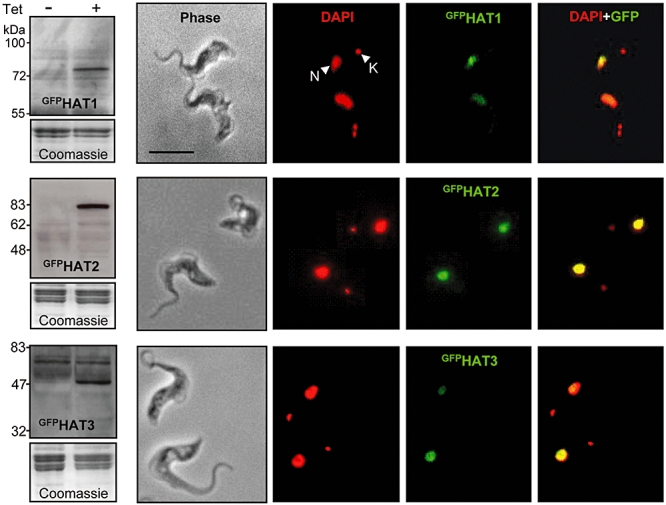
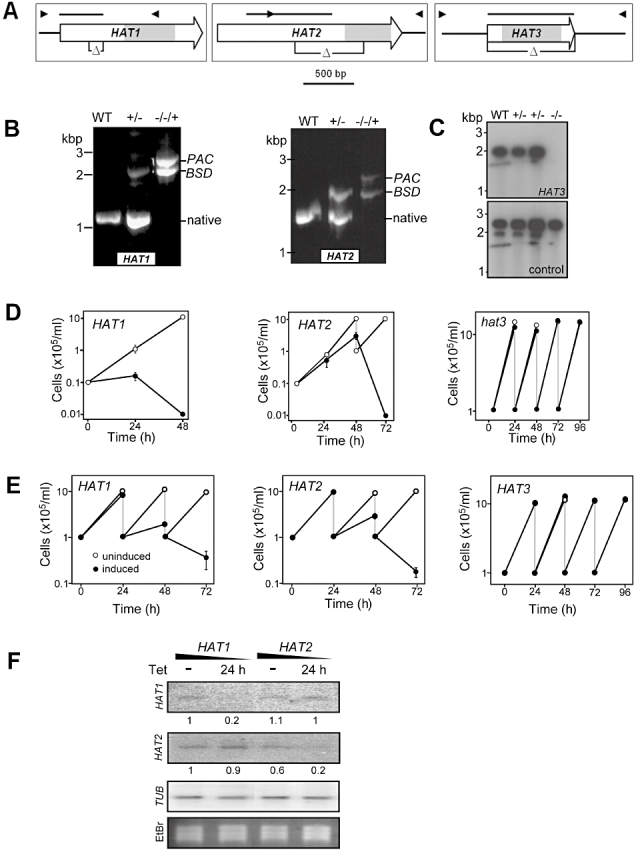
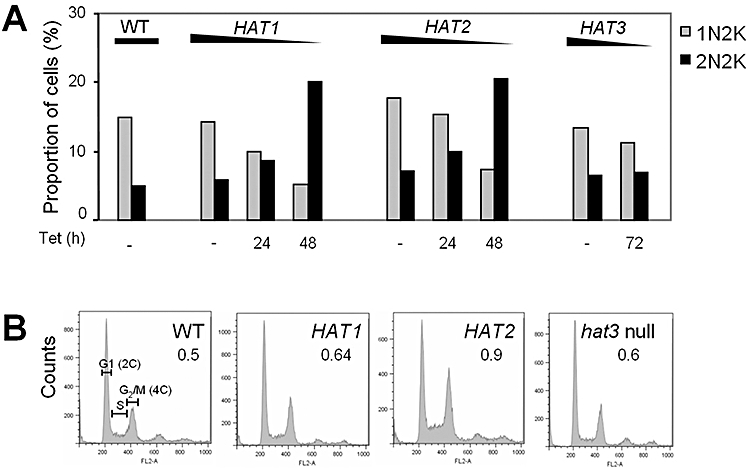
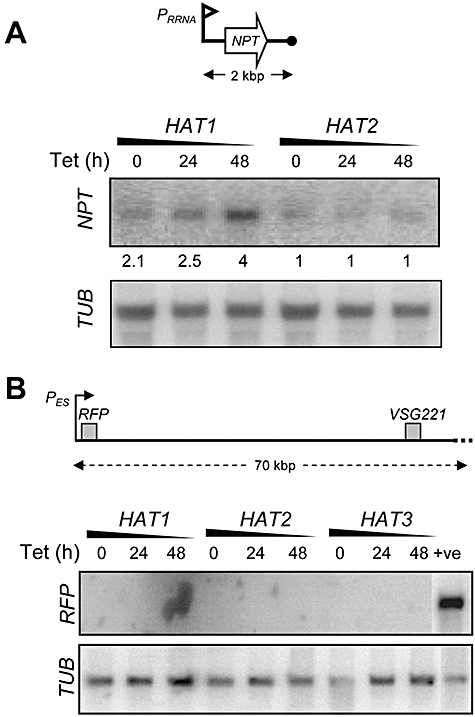
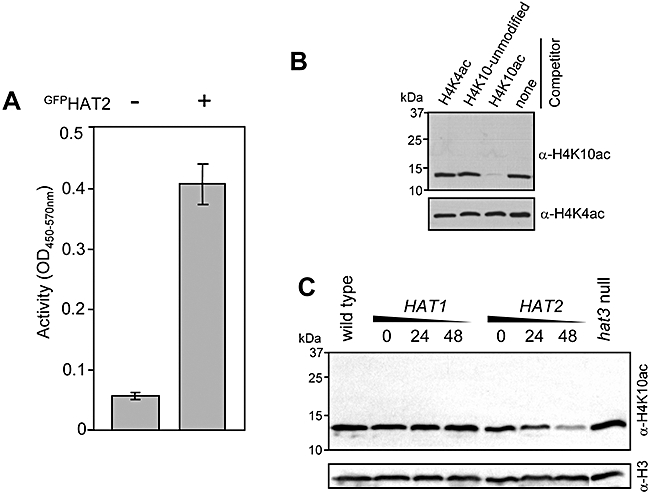
Chromatin modification is important for virtually all aspects of DNA metabolism but little is known about the consequences of such modification in trypanosomatids, early branching protozoa of significant medical and veterinary importance. MYST-family histone acetyltransferases in other species function in transcription regulation, DNA replication, recombination and repair. Trypanosoma brucei HAT3 was recently shown to acetylate histone H4K4 and we now report characterization of all three T. brucei MYST acetyltransferases (HAT1-3). First, GFP-tagged HAT1-3 all localize to the trypanosome nucleus. While HAT3 is dispensable, both HAT1 and HAT2 are essential for growth. Strains with HAT1 knock-down display mitosis without nuclear DNA replication and also specific de-repression of a telomeric reporter gene, a rare example of transcription control in an organism with widespread and constitutive polycistronic transcription. Finally, we show that HAT2 is responsible for H4K10 acetylation. By analogy to the situation in Saccharomyces cerevisiae, we discuss low-level redundancy of acetyltransferase function in T. brucei and suggest that two MYST-family acetyltransferases are essential due to the absence of a Gcn5 homologue. The results are also consistent with the idea that HAT1 contributes to establishing boundaries between transcriptionally active and repressed telomeric domains in T. brucei.


Figures

Fig. 1
Fig. 1
Phylogenetic analysis. The trypanosomatid HATs were compared with other MYST-family proteins. The unrooted neighbour-joining tree was generated using clustal 1.8X and TreeView. Where excellent (≥ 99.9%), branching confidence is indicated (open circles). Tb, T. brucei; Tc, T. cruzi; Lm, L. major; Hs, Homo sapiens; Sc, S. cerevisiae; Gl, Giardia lamblia; Eh, Entamoeba histolytica; Sp, Schizosaccharomyces pombe; Pf, Plasmodium falciparum; Tg, Toxoplasma gondii. All accession numbers are indicated. The GeneDB IDs for the T. brucei proteins are: HAT1, Tb927.7.4560; HAT2, Tb11.01.3380; and HAT3, Tb10.6k15.2190.
Fig. 2
Fig. 2
MYST-family acetyltransferases in T. brucei. A. Schematic representation of the predicted T. brucei MYST-family proteins compared with S. cerevisiae Esa1. The core acetyltransferase domains (grey boxes) and N-terminal chromodomains (black boxes and cross-hatched box; see the text) are indicated. Arrowheads indicate a C2HC zinc-finger motif. ‘A’ indicates motif A. B. Sequence alignment. The core acetyltransferase domains from the T. brucei HATs were aligned with the equivalent region from Esa1 using clustalw followed by manual adjustment. Residues that are shared between Esa1 and any of the T. brucei proteins are white on a black background. Other residues shared among the T. brucei proteins are on a grey background. Motif A and the zinc-finger motif are indicated (see A). Asterisks indicate a glutamate residue [E] and a cysteine residue [C] required for Esa1 catalytic activity. Insertions within the HAT1 and HAT2 MYST-homology domains have been removed to optimize the alignment. The box shows the trypanosomatid chromodomain from HAT1 aligned with the corresponding domain from S. cerevisiae Esa1.
Fig. 3
Fig. 3
MYST-family proteins localize to the T. brucei nucleus. Strains were cultured without Tet (−) or with Tet (1 μg ml−1) for 24 h (+) to induce GFPHAT expression. Fusion proteins were detected by Western blotting using α-GFP (left). Coomassie-stained gels are shown as loading controls. Representative examples of immunofluorescence (HAT1 and HAT3) or direct fluorescence (HAT2) images of induced cultures are shown. HAT localization is indicated in green. DAPI, the DNA counterstain (4′,6-diamino-2-phenylindole), is false-coloured red and reveals the nucleus (N) and the smaller mitochondrial, kinetoplast DNA (K). Merged images indicate nuclear colocalization in yellow. Scale bar: 10 μm.
Fig. 4
Fig. 4
HAT3 is dispensable while HAT1 and HAT2 are essential for growth. A. Schematics illustrating the gene targeting strategies. The symbols ‘Δ’ indicate regions targeted for deletion. Arrowheads represent the positions of the primers used for PCR assays; 29M45/3, 18M145/3 and H31/4 for HAT1–3 respectively; bars represent probes used for Southern and Northern blot analysis and the grey boxes indicate the regions targeted for RNAi by dsRNA. B. Genomic DNA from clones with both native alleles disrupted in the presence of conditionally expressed GFPHAT1 and GFPHAT2 were analysed by PCR and the products were visualized in agarose gels. The BSD and PAC cassettes are 1 and 1.3 kb respectively. The recombinant GFPHAT genes are not detected using this assay (see primer locations in A). C. Southern blot analysis of hat3 null T. brucei. Genomic DNA was digested with AccI and the blot was sequentially hybridized with the probes indicated (the control probe is from HAT1, see bars in A). D. Growth analysis of strains expressing conditional copies of GFPHAT1 or GFPHAT2 and a hat3 null strain. For GFPHAT1 and GFPHAT2: GFPHAT expressed (+Tet), open circles; GFPHAT expression inactivated (−Tet), closed circles. For HAT3: wild type, open circles; hat3 null, closed circles. Cells were split back to 1 × 10⁵ ml−1 every 24 h (grey lines). Error bars, ± one standard deviation. E. Growth analysis of three independent RNAi strains during knock-down of each HAT (target regions indicated in A). Un-induced, open circles; RNAi induced (+Tet), closed circles. Cells were split back to 1 × 10⁵ ml−1 every 24 h (grey lines). Error bars, ± one standard deviation. F. Northern analysis during RNAi knock-down. Membranes were probed with HAT1 and HAT2 gene fragments (see bars in A). Tubulin (TUB) was used as a loading control. Relative HAT1 or HAT2 mRNA signals, as determined by phosphorimager analysis and corrected for loading, are indicated. EtBr, ethidium bromide.
Fig. 5
Fig. 5
Cell cycle analysis following HAT knock-down. A. Analysis of DAPI-stained T. brucei. 1N2K indicates cells with a single nucleus and two kinetoplasts and corresponds to nuclear G2. 2N2K indicates cells with two nuclei and two kinetoplasts and corresponds to completion of mitosis. n > 300 cells for each sample per time point. B. DNA content analysis using flow cytometry. HAT1- and HAT2-depleted cells were analysed following 48 h +Tet. A hat3 null strain was analysed in parallel. 2C, cells with a diploid nuclear content; 4C, cells that have passed through S-phase and replicated their DNA. The proportion of 4C relative to 2C is indicated. n = 20 000 cells.
Fig. 6
Fig. 6
HAT1 modulates telomeric silencing but not VSG expression site repression. A. A ribosomal RNA promoter (PRRNA) driving the expression of an NPT gene was placed 2 kb from a telomere in HAT RNAi strains. NPT expression was assessed before and after knock-down by Northern blot. TUB was used as a loading control. Relative NPT expression, determined by phosphorimager analysis and corrected for loading, is indicated. B. HAT1–3 knock-down was induced in strains with an RFP reporter immediately downstream of a repressed VSG221 expression site promoter (PES). RFP expression was assessed before and after knock-down using Northern blotting. The positive control is a similar strain but expressing VSG221. Tubulin (TUB) was used as a loading control. All of the knock-down samples expressed RFP at < 1% relative to the control as determined by phosphorimager analysis.
Fig. 7
Fig. 7
HAT2 acetylates histone H4K10. A. In vitro acetyltransferase activity assay using eluates from T. brucei lacking (−) or expressing (+) GFPHAT2. The substrate was a T. brucei histone H4 tail peptide (H4A1-L20). n = 3. Error bars, ± one standard deviation. B. Characterization of α-histone H4K10ac. A Western blot of whole trypanosome extracts (2 × 10⁶ cells lane−1) was probed using α-H4K10ac. Peptide competitors used are shown above. To confirm equal loading, the blot was stripped and reprobed with α-H4K4ac (Siegel et al., 2008). C. Specific depletion of the H4K10ac signal following HAT2 knock-down by RNAi. Western blotting was carried out as for (B) but without peptide competitor. Note that Siegel et al. (2008) demonstrated that total H4 levels are not depleted during HAT2 knock-down. To confirm equal loading, the blot was stripped and reprobed with α-histone H3.

References

    1. Akhtar A, Becker PB. The histone H4 acetyltransferase MOF uses a C2HC zinc finger for substrate recognition. EMBO Rep. 2001;2:113–118. - PMC - PubMed
    1. Akhtar A, Zink D, Becker PB. Chromodomains are protein–RNA interaction modules. Nature. 2000;407:405–409. - PubMed
    1. Alsford S, Kawahara T, Glover L, Horn D. Tagging a T. brucei RRNA locus improves stable transfection efficiency and circumvents inducible expression position effects. Mol Biochem Parasitol. 2005;144:142–148. - PMC - PubMed
    1. Alsford S, Kawahara T, Isamah C, Horn D. A sirtuin in the African trypanosome is involved in both DNA repair and telomeric gene silencing but is not required for antigenic variation. Mol Microbiol. 2007;63:724–736. - PubMed
    1. Ausubel FM, Brent R, Kingston RE, Moore DD, Seidman JG, Smith JA, Struhl K. Current Protocols in Molecular Biology. New York, NY: John Wiley and Sons; 1998.

Publication types

LinkOut - more resources