. 2008 Jul 22;105(29):10039-44.
doi: 10.1073/pnas.0800679105. Epub 2008 Jul 16.

Modular networks and cumulative impact of lateral transfer in prokaryote genome evolution

Affiliations

Modular networks and cumulative impact of lateral transfer in prokaryote genome evolution

Tal Dagan et al. Proc Natl Acad Sci U S A. .

Abstract

Lateral gene transfer is an important mechanism of natural variation among prokaryotes, but the significance of its quantitative contribution to genome evolution is debated. Here, we report networks that capture both vertical and lateral components of evolutionary history among 539,723 genes distributed across 181 sequenced prokaryotic genomes. Partitioning of these networks by an eigenspectrum analysis identifies community structure in prokaryotic gene-sharing networks, the modules of which do not correspond to a strictly hierarchical prokaryotic classification. Our results indicate that, on average, at least 81 +/- 15% of the genes in each genome studied were involved in lateral gene transfer at some point in their history, even though they can be vertically inherited after acquisition, uncovering a substantial cumulative effect of lateral gene transfer on longer evolutionary time scales.


Conflict of interest statement

The authors declare no conflict of interest.

Figures
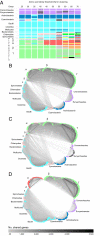
Fig. 1.
Fig. 1.
Modules in networks of shared genes. (A) Modules detected (see Materials and Methods) are shown as colored boxes within columns for thresholds from T25 to T70. Currently recognized higher-level taxonomic groups are indicated in rows for comparison. For example, for the network at T25 all but one actinobacteria and the cyanobacterium, Thermosynechococcus elongatusform, form one module, which is dark blue. An expanded version of the panel containing all species names is given in Figs. S1–S3. (B) Modules in the gene-sharing network at T30. Only edges connecting within modules are shown, edge shading is proportional to the number of shared genes per edge (see scale). Vertices (genomes) are colored according to their module as in a, vertex radius is linearly scaled to centrality (see text). (C) Modules in the gene-sharing network at T40. (D) Modules in the gene-sharing network at T50.
Fig. 2.
Fig. 2.
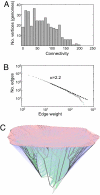
Properties of the minimal LGT network. Properties are shown for a randomly selected replicate. The coefficient of variation (CV) for the whole data were ≪1% (Fig. S6). (A) Distribution of connectivity, the number of one-edge-distanced neighbors for each vertex, in the MLN. Note the absence of vertices that are far more highly connected than others (hubs). (B) Frequency distribution of edge weight in the lateral component of the MLN. (C) A three-dimensional projection of the MLN. Edges in the vertical component are shown in the same grayscale as in Fig. 3. Vertices inferred as gene origin in the same protein family are connected by a lateral edge. Lateral edges are classified into three groups according to the types of vertices they connect within the vertical component: 4,040 external-external edges (red), 5,862 internal-external edges (blue), and 2,345 internal-internal edges (green).
Fig. 3.
Fig. 3.
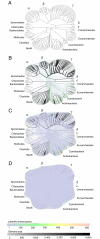
A minimal LGT network for 181 genomes. (A) The reference tree used to ascribe vertical inheritance for inference of the MLN (see Materials and Methods). (B) The network showing only the 823 edges of weight ≥20 genes. Vertical edges are indicated in gray, with both the width and the shading of the edge shown proportional to the number of inferred vertically inherited genes along the edge (see the scale). The lateral network is indicated by edges that do not map onto the vertical component, with number of genes per edge indicated in color (see the scale). (C) The MLN showing only the 3,764 edges of weight ≥5 genes. (D) The MLN showing all 15,127 edges of weight ≥1 gene in the MLN.

References

    1. Thomas CM, Nielsen KM. Mechanisms of, and barriers to, horizontal gene transfer between bacteria. Nat Rev Microbiol. 2005;3:711–721. - PubMed
    1. Lang AS, Beatty JT. Importance of widespread gene transfer agent genes in alpha-proteobacteria. Trends Microbiol. 2007;15:54–62. - PubMed
    1. Moran NA. Symbiosis as an adaptive process and source of phenotypic complexity. Proc Natl Acad Sci USA. 2007;104:8627–8633. - PMC - PubMed
    1. Doolittle WF. Phylogenetic classification and the universal tree. Science. 1999;284:2124–2128. - PubMed
    1. Gogarten JP, Doolittle WF, Lawrence JG. Prokaryotic evolution in light of gene transfer. Mol Biol Evol. 2002;19:2226–2238. - PubMed

Publication types

Substances

LinkOut - more resources