Genomic alterations indicate tumor origin and varied metastatic potential of disseminated cells from prostate cancer patients
- PMID: 18632612
- PMCID: PMC2613025
- DOI: 10.1158/0008-5472.CAN-08-0812
Genomic alterations indicate tumor origin and varied metastatic potential of disseminated cells from prostate cancer patients
Abstract
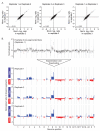
Disseminated epithelial cells can be isolated from the bone marrow of a far greater fraction of prostate-cancer patients than the fraction of patients who progress to metastatic disease. To provide a better understanding of these cells, we have characterized their genomic alterations. We first present an array comparative genomic hybridization method capable of detecting genomic changes in the small number of disseminated cells (10-20) that can typically be obtained from bone marrow aspirates of prostate-cancer patients. We show multiple regions of copy-number change, including alterations common in prostate cancer, such as 8p loss, 8q gain, and gain encompassing the androgen-receptor gene on Xq, in the disseminated cell pools from 11 metastatic patients. We found fewer and less striking genomic alterations in the 48 pools of disseminated cells from patients with organ-confined disease. However, we identify changes shared by these samples with their corresponding primary tumors and prostate-cancer alterations reported in the literature, evidence that these cells, like those in advanced disease, are disseminated tumor cells (DTC). We also show that DTCs from patients with advanced and localized disease share several abnormalities, including losses containing cell-adhesion genes and alterations reported to associate with progressive disease. These shared alterations might confer the capability to disseminate or establish secondary disease. Overall, the spectrum of genomic deviations is evidence for metastatic capacity in advanced-disease DTCs and for variation in that capacity in DTCs from localized disease. Our analysis lays the foundation for elucidation of the relationship between DTC genomic alterations and progressive prostate cancer.
Figures


References
-
- Pantel K, Brakenhoff RH. Dissecting the metastatic cascade. Nat Rev Cancer. 2004;4:448–56. - PubMed
-
- Cone S. A case of carcinoma metastases in bone from a primary tumor of the prostate. Johns Hopkins Hospital Bulletin. 1898;9:114–8.
-
- Partin AW, Kattan MW, Subong EN, et al. Combination of prostate-specific antigen, clinical stage, and Gleason score to predict pathological stage of localized prostate cancer. A multi-institutional update. Jama. 1997;277:1445–51. - PubMed
-
- Partin AW, Mangold LA, Lamm DM, Walsh PC, Epstein JI, Pearson JD. Contemporary update of prostate cancer staging nomograms (Partin Tables) for the new millennium. Urology. 2001;58:843–8. - PubMed
-
- Greenlee RT, Murray T, Bolden S, Wingo PA. Cancer statistics, 2000. CA Cancer J Clin. 2000;50:7–33. - PubMed
Publication types
MeSH terms
Grants and funding
- R01 AG014358/AG/NIA NIH HHS/United States
- P50 CA097186/CA/NCI NIH HHS/United States
- R01 DC004209/DC/NIDCD NIH HHS/United States
- T32 HG000035/HG/NHGRI NIH HHS/United States
- R01-AG14358/AG/NIA NIH HHS/United States
- R01-DC004209/DC/NIDCD NIH HHS/United States
- T32 HG00035/HG/NHGRI NIH HHS/United States
- R01-CA95717/CA/NCI NIH HHS/United States
- P30-CA15704-31/CA/NCI NIH HHS/United States
- P50-CA97186/CA/NCI NIH HHS/United States
- R01 CA095717/CA/NCI NIH HHS/United States
- CA97186/CA/NCI NIH HHS/United States
- R01 CA098415/CA/NCI NIH HHS/United States
- P30 CA015704/CA/NCI NIH HHS/United States
- U24-CA80295/CA/NCI NIH HHS/United States
- U24 CA080295/CA/NCI NIH HHS/United States
LinkOut - more resources
Full Text Sources
Other Literature Sources
Medical
Molecular Biology Databases

