Tariquidar-induced P-glycoprotein inhibition at the rat blood-brain barrier studied with (R)-11C-verapamil and PET
- PMID: 18632828
- PMCID: PMC3690700
- DOI: 10.2967/jnumed.108.051235
Tariquidar-induced P-glycoprotein inhibition at the rat blood-brain barrier studied with (R)-11C-verapamil and PET
Abstract
The multidrug efflux transporter P-glycoprotein (P-gp) is expressed in high concentrations at the blood-brain barrier (BBB) and is believed to be implicated in resistance to central nervous system drugs. We used small-animal PET and (R)-11C-verapamil together with tariquidar, a new-generation P-gp modulator, to study the functional activity of P-gp at the BBB of rats. To enable a comparison with human PET data, we performed kinetic modeling to estimate the rate constants of radiotracer transport across the rat BBB.
Methods: A group of 7 Wistar Unilever rats underwent paired (R)-11C-verapamil PET scans at an interval of 3 h: 1 baseline scan and 1 scan after intravenous injection of tariquidar (15 mg/kg, n = 5) or vehicle (n = 2).
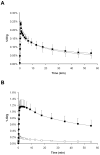
Results: After tariquidar administration, the distribution volume (DV) of (R)-11C-verapamil was 12-fold higher than baseline (3.68 +/- 0.81 vs. 0.30 +/- 0.08; P = 0.0007, paired t test), whereas the DVs were essentially the same when only vehicle was administered. The increase in DV could be attributed mainly to an increased influx rate constant (K1) of (R)-11C-verapamil into the brain, which was about 8-fold higher after tariquidar. A dose-response assessment with tariquidar provided an estimated half-maximum effect dose of 8.4 +/- 9.5 mg/kg.
Conclusion: Our data demonstrate that (R)-11C-verapamil PET combined with tariquidar administration is a promising approach to measure P-gp function at the BBB.
Figures


References
-
- Ambudkar SV, Dey S, Hrycyna CA, Ramachandra M, Pastan I, Gottesman MM. Biochemical, cellular, and pharmacological aspects of the multidrug transporter. Annu Rev Pharmacol Toxicol. 1999;39:361–398. - PubMed
-
- Löscher W, Potschka H. Drug resistance in brain diseases and the role of drug efflux transporters. Nat Rev Neurosci. 2005;6:591–602. - PubMed
-
- Drozdzik M, Bialecka M, Mysliwiec K, Honczarenko K, Stankiewicz J, Sych Z. Polymorphism in the P-glycoprotein drug transporter MDR1 gene: a possible link between environmental and genetic factors in Parkinson’s disease. Pharmacogenetics. 2003;13:259–263. - PubMed
Publication types
MeSH terms
Substances
Grants and funding
LinkOut - more resources
Full Text Sources
Other Literature Sources
Miscellaneous
