. 2008 Sep;100(3):1562-75.
doi: 10.1152/jn.90613.2008. Epub 2008 Jul 16.

Effect of synaptic connectivity on long-range synchronization of fast cortical oscillations

Affiliations

Effect of synaptic connectivity on long-range synchronization of fast cortical oscillations

M Bazhenov et al. J Neurophysiol. 2008 Sep.

Erratum in

  • J Neurophysiol. 2008 Dec;100(6):3460

Abstract

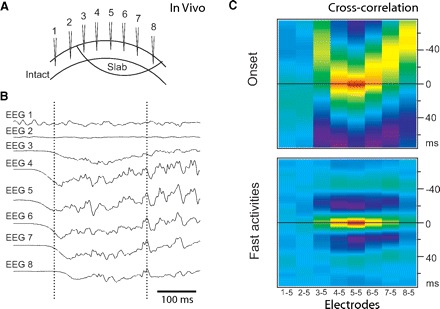
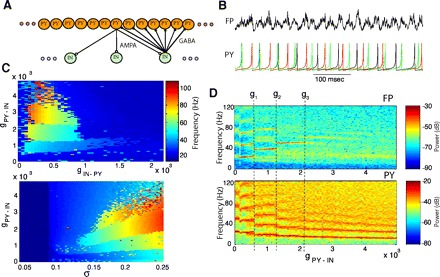
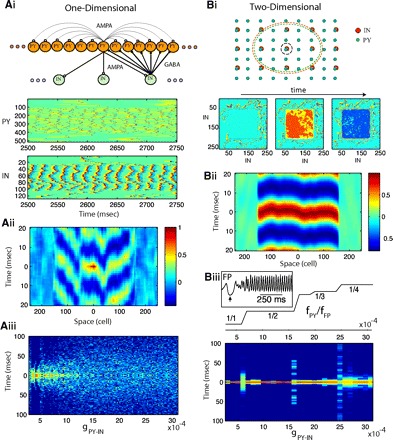
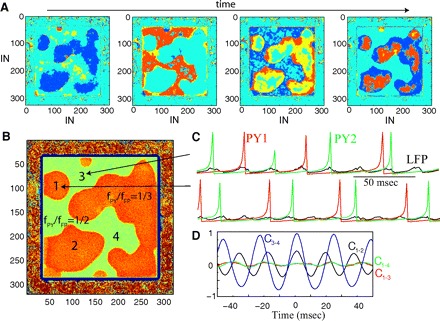
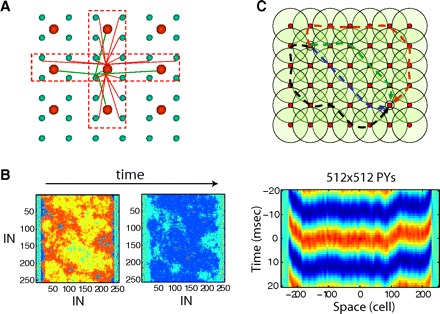
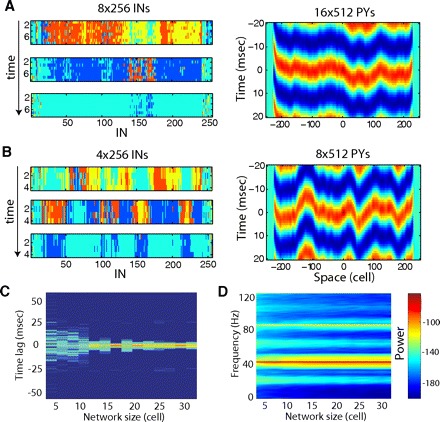
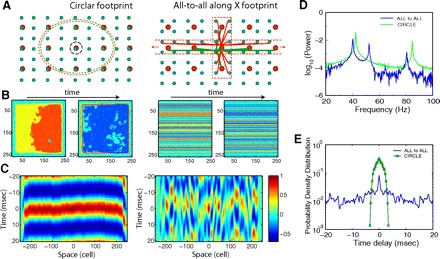
Cortical gamma oscillations in the 20- to 80-Hz range are associated with attentiveness and sensory perception and have strong connections to both cognitive processing and temporal binding of sensory stimuli. These gamma oscillations become synchronized within a few milliseconds over distances spanning a few millimeters in spite of synaptic delays. In this study using in vivo recordings and large-scale cortical network models, we reveal a critical role played by the network geometry in achieving precise long-range synchronization in the gamma frequency band. Our results indicate that the presence of many independent synaptic pathways in a two-dimensional network facilitate precise phase synchronization of fast gamma band oscillations with nearly zero phase delays between remote network sites. These findings predict a common mechanism of precise oscillatory synchronization in neuronal networks.


Figures

FIG. 1.
FIG. 1.
Model properties. A: steady-state response pattern of excitatory (PY) neuron for 3 different levels of the resting potential. Black, σ = 0.06; green, σ = 0.09; blue, σ = 0.17. B: inhibitory postsynaptic potential (IPSP) in the postsynaptic PY neuron (bottom) triggered by a spike in presynaptic interneuron (IN) (top).
FIG. 2.
FIG. 2.
Fast gamma oscillation in vivo. Patterns of activity onset and synchronization during active states in a neocortical slab 6 × 10 mm. A: the position of recording electrodes. Distance between electrodes ∼1.5 mm. B: the active state started from around electrode 5 (see left vertical line) and propagated to other electrodes. C, top: cross-correlation of the onset of active states (electrode 5 is the reference, analyzed fragments from −100 to +100 ms of electrode 5 half-amplitude). Bottom: cross-correlation during active states (electrode 5 is the reference, analyzed fragments from +200 to +400 ms of electrode 5 half-amplitude). Note the absence of correlation between activities in the slab (electrodes 3–8) and outside the slab (electrodes 1 and 2).
FIG. 3.
FIG. 3.
Effect of synaptic coupling on fast network model oscillations. A: structure of synaptic connectivity in a cortical network model including 512 PY neurons and 128 INs. AMPA, excitatory synapses; GABA, inhibitory synapses. B: field potential (top) and representative PY neurons (bottom) during gamma oscillations. C, top: frequency of field potential oscillations is plotted as a function of inhibitory feedback: excitatory PY → IN and inhibitory IN → PY coupling. Bottom: frequency of field potential oscillations is plotted as a function of excitatory PY → IN coupling and resting potential (σ): σ = 0.09 corresponds to the onset of spiking; σ = 0.17 corresponds to ∼20-Hz sustained firing rate. D: spectrograms representing the power spectrum of the field (top) and PY (bottom) oscillations as a function of PY → IN coupling for a fixed value of IN → PY coupling (g = 0.0007).
FIG. 4.
FIG. 4.
Synchrony of oscillations in 1- and 2-dimensional (2D) network models. Group of PY neurons [with indexes (107,406) for 1D or (107,406) × (107,406) for 2D] was entrained to gamma oscillations by DC input. A: 1D model: 512 PY neurons and 128 INs. Ai, top: connectivity structure. Bottom: spatiotemporal patterns of activity in a 1D network (gIN-PY = 0.0007, gPY-IN = 0.0015). Spikes are shown in red; dark blue indicates hyperpolarization. Aii: cross-correlation of the local field potential (averaged over 20 PY neurons) between the center of the network and remote sites. Aiii: time lags to the main peak of the cross-correlation function between local field potentials in different spatial locations (see methods) plotted for various strengths of PY-IN coupling. Color indicates number of time lags within 1 ms bins (dark blue indicates no lags). B: 2D model: 512 × 512 PY neurons and 256 × 256 INs. Bi, top: connectivity structure. Red and green dashed circuits illustrate radii of PY-IN and IN-PY connectivity for a single PY and IN neurons (shown with black circuit). Bottom: snapshots of activity in the IN population during global coherent gamma oscillation at times t0, t0+5 ms, t0+8 ms. Bii: cross-correlation of the local field potential (averaged over 20 × 20 PY neurons) between the center of the network and remote sites along the x axis. Biii, top: the staircase structure of resonance modes (fPY/fFP ) is shown as a function of PY-IN coupling. Bottom: same as in Fig. 3Aiii but for a 2D network. Inset: field potential oscillations near the onset of DC input (↑).
FIG. 5.
FIG. 5.
Two-dimensional network dynamics at the transition between 2 resonance states. A: representative snapshots of network activity at 4 different times illustrated with IN population. Network size: 640 × 640 PY neurons and 320 × 320 INs. B: spatial distribution of the resonance modes computed as the ratio of the total number of IN spikes to the total number of PY spikes in each network site during a given time interval. Orange (green) area indicates fPY/fFP = 1/3 (fPY/fFP = 1/2) resonance mode, respectively. Note that the population of neurons in fPY/fFP = 1/3 mode (orange area) is broken into several disjointed sets. C: examples of oscillations in 2 network sites (1 and 3 in B) belonging to different resonance areas (black indicats field potential; green and red indicates PY neurons). D: cross-correlation of the field oscillations among 4 network sites indicated in B. The synchrony was high between sites 3 and 4 (C3–4, the same population); moderate between sites 1 and 2 (C1–2, disjoint populations of the same type); low between 1 and 3 or 1 and 4 (C1–3, C1–4, populations oscillating in different resonance modes).
FIG. 6.
FIG. 6.
Effect of network connectivity structure on gamma range synchronization. A: “cross-like” connectivity structure in a 2D network. B: oscillations in the network with cross-like connectivity: 512 × 512 PY neurons and 256 × 256 INs. Left: snapshots of spiking activity in the IN population. Right: cross-correlation of the field potential oscillations (averaged over 10 × 10 PY neurons) between the center of the network and remote sites along the x axis as a function of the distance between the sites. C: multiple independent pathways with different synaptic lengths connect any 2 sites in a 2D network. Circles illustrate the synaptic connectivity of INs (red dots). Dashed lines illustrate different pathways connecting 2 selected INs (black dots).
FIG. 7.
FIG. 7.
Effect of network dimensionality on gamma range synchronization. A: oscillations in the 16 × 512 PYs (8 × 256 INs) network model. Snapshots of IN activity as 3 different times (left) and cross-correlation of field potentials along x axis (right). B: oscillations in the 8 × 512 PYs (4 × 256 INs) network model. C: normalized probability density distribution of time lags to the main peak of the cross-correlation function between local field potentials at different spatial locations as a function of the network size along the y dimension. Logarithmic scale. Results are averaged across 15 independent trials with randomly selected initial conditions. Note disappearance of the isolated peak for the network of size <1 footprint (8 PY neurons). D: spectrogram of the local field potential [averaged across all neurons within (150,350) × (1, N) area, where N is number of PY neurons along y axis] as a function of the network's size along the y-dimension. Logarithmic scale (dB). E, left: cross-correlation of field potentials along x axis in 2D model with radius of the synaptic footprint 4 for PY-PY and PY-IN synapses (total 47 and 48 neurons, respectively) and 2 for IN-PY synapses (total 13 neurons). Right: cross-correlation of field potentials along the chain of neurons in 1D model with radius of the synaptic footprint 24 for PY-PY and PY-IN synapses (total 47 and 48 neurons, respectively) and 6 for IN-PY synapses (total 13 neurons). Not only is delay to the peak of cross-correlation function larger in 1D model but also the amplitude of the correlation function is significantly reduced in 1D model.
FIG. 8.
FIG. 8.
Effect of connectivity patterns on the network synchronization. A: connectivity structure for 2 different networks, 512 × 512 PY neurons and 256 × 256 INs. Left: circular footprint. The radius of the synaptic footprint: 18 for neurons with AMPA mediated PY-PY synapses, 18 for neurons with AMPA-mediated PY-IN synapses and 9 for neurons with GABAA-mediated IN-PY synapses. Right: cross-like footprint with all-to-all connections along the x axis. B: snapshots of activity in the IN population. C: cross-correlation of the field potential oscillations between the center of the network and remote sites along the y axis as a function of the distance between the sites. D: power spectra of field potential oscillations. For both networks, the main peak was at ∼40 Hz with subharmonics at ∼80 Hz. Network with all-to-all connections along the x-axis also showed a 2nd peak at ∼50 Hz. Logarithmic scale. E: normalized probability density distribution of time lags to the peak of the cross-correlation function between local field potentials at different spatial locations. Logarithmic scale.

References

    1. Adrian ED. The electrical activity of the mammalian olfactory bulb. Electroencephalogr Clin Neurophysiol 2: 377–388, 1950 - PubMed
    1. Assisi C, Stopfer M, Laurent G, Bazhenov M. Adaptive regulation of sparseness by feedforward inhibition. Nat Neurosci 10: 1176–1184, 2007 - PMC - PubMed
    1. Axmacher N, Mormann F, G. F, Cohen MX, Elger CE, Fell J. Sustained neural activity patterns during working memory in the human medial temporal lobe. J Neurosci 27: 7807–7816, 2007 - PMC - PubMed
    1. Bazhenov M, Rulkov NF, Fellous J-M, Timofeev I. Role of network dynamics in shaping spike timing reliability. Phys Rev E Stat Nonlin Soft Matter Phys 041903, 2005. - PubMed
    1. Bazhenov M, Stopfer M, Rabinovich M, Huerta R, Abarbanel HD, Sejnowski TJ, Laurent G. Model of transient oscillatory synchronization in the locust antennal lobe. Neuron 30: 553–567, 2001 - PMC - PubMed

Publication types

LinkOut - more resources