Comparative Study
. 2008 Jul 16;28(29):7324-33.
doi: 10.1523/JNEUROSCI.1909-08.2008.

Different CA1 and CA3 representations of novel routes in a shortcut situation

Affiliations
Comparative Study

Different CA1 and CA3 representations of novel routes in a shortcut situation

Alice Alvernhe et al. J Neurosci. .

Abstract

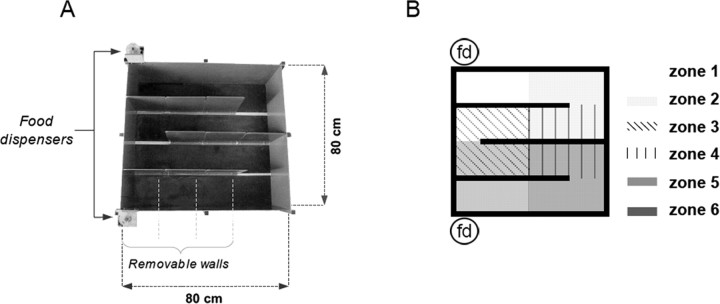
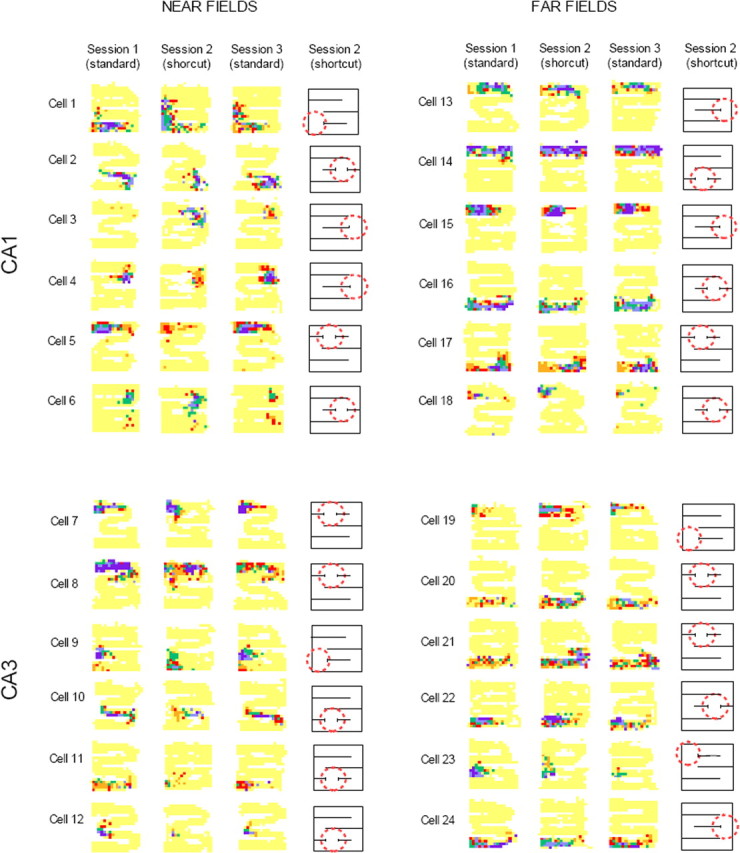
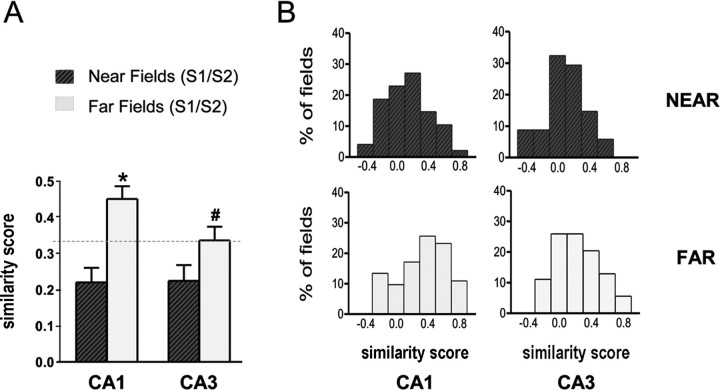
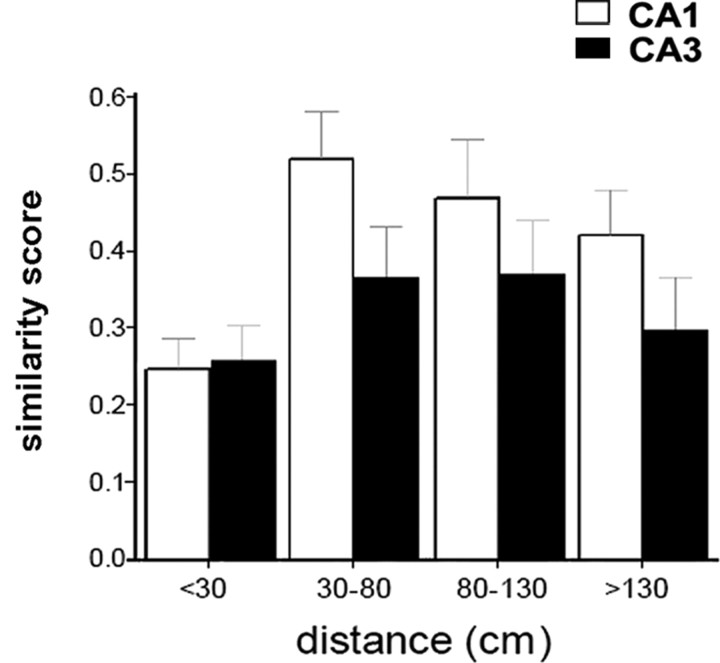
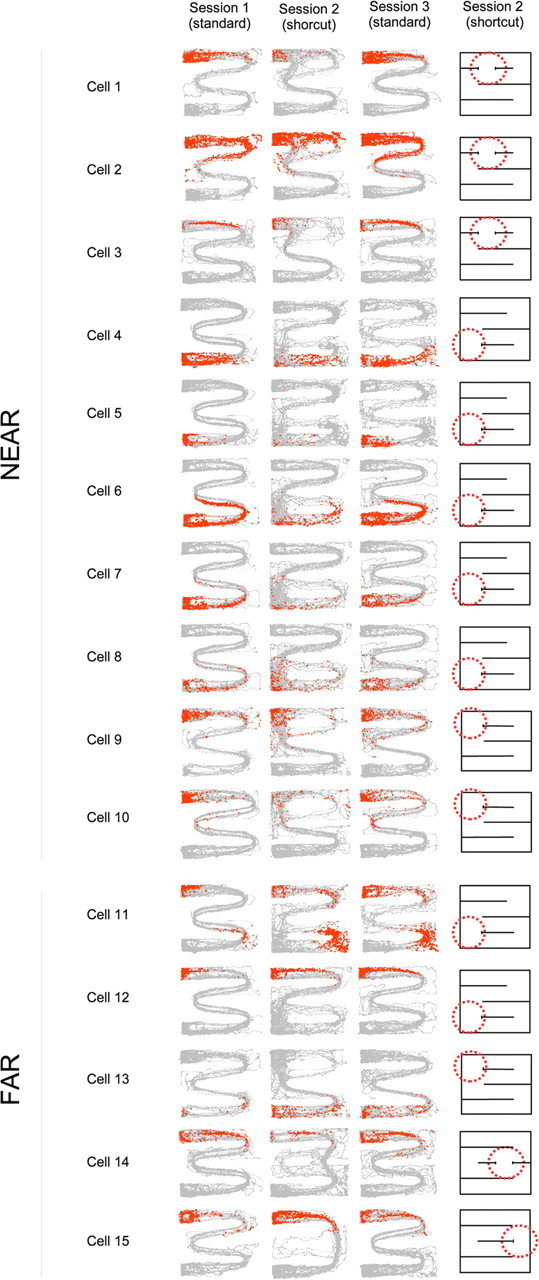
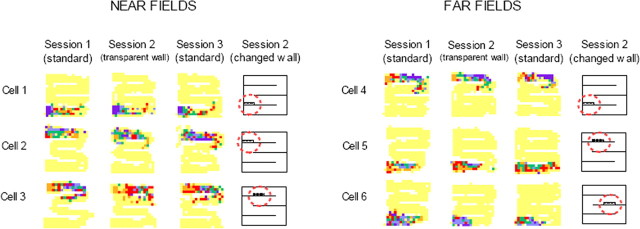
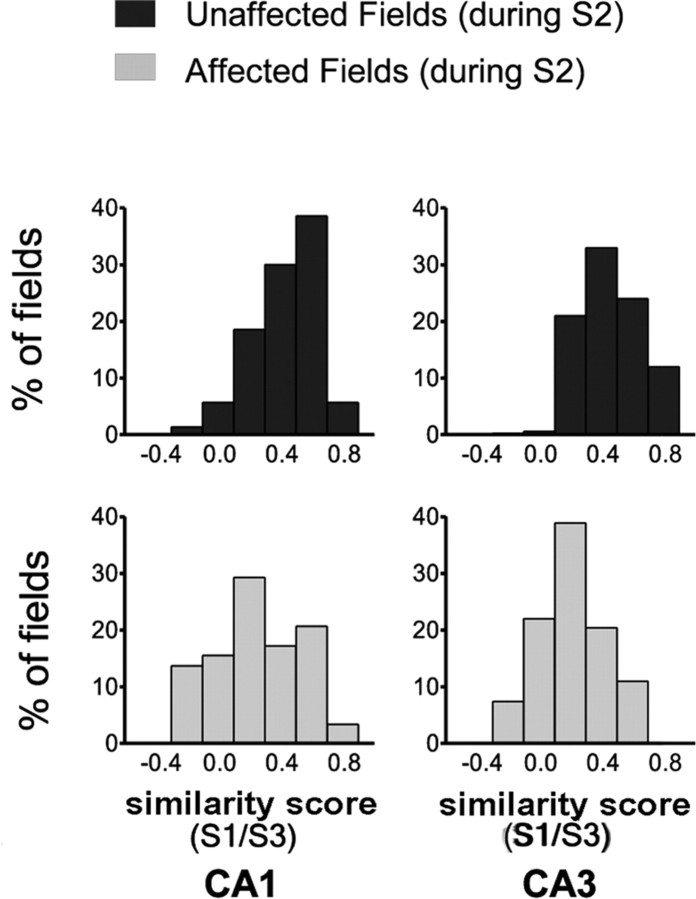
Place cells are hippocampal neurons whose discharge is strongly related to a rat's location in its environment. The existence of place cells has led to the proposal that they are part of an integrated neural system dedicated to spatial navigation. To further understand the relationships between place cell firing and spatial problem solving, we examined the discharge of CA1 and CA3 place cells as rats were exposed to a shortcut in a runway maze. On specific sessions, a wall section of the maze was removed so as to open a shorter novel route within the otherwise familiar maze. We found that the discharge of both CA1 and CA3 cells was strongly affected in the vicinity of the shortcut region but was much less affected farther away. In addition, CA3 fields away from the shortcut were more altered than CA1 fields. Thus, place cell firing appears to reflect more than just the animal's spatial location and may provide additional information about possible motions, or routes, within the environment. This kinematic representation appears to be spatially more extended in CA3 than in CA1, suggesting interesting computational differences between the two subregions.


Figures

Figure 1.
Figure 1.
A photograph of the maze and a schematic representation of the six zones used for calculating field similarity scores. A, B, Two food dispensers (fd) at the ends of the M-shaped runway were remotely controlled to keep the rat reliably running back and forth in the maze. Each inner maze wall was made of independent sections that could be separately removed. The six zones used for analyses of field similarity were defined so that analyses could be conducted whatever the field location was within the maze.
Figure 2.
Figure 2.
Firing rate maps for place cells across the three sessions of a recording sequence. In all maps, yellow indicates no firing, and purple indicates maximum firing (orange, red, green, and blue indicate intermediate firing rates from low to high). The same color code was used for all three sessions of a recording sequence. For each recording sequence, a schematic map of the maze is provided, showing shortcut location (dashed red circle). Near fields were more strongly affected than far fields. In addition, CA3 far fields were more affected than CA1 far fields.
Figure 3.
Figure 3.
Similarity scores after wall removal. A, Mean similarity scores (±SEM) for near and far fields in CA1 and CA3 cells. Correlation coefficients (rs) between the firing rate maps obtained for standard and shortcut sessions were used as an index of similarity between the spatial firing patterns. The dashed line is set at 0.33 to illustrate the threshold beyond which fields may be judged to be altered after wall removal. *p < 0.0001 compared with CA1 near fields; #p < 0.05 compared with CA1 far fields. S1, Session 1; S2, session 2. B, Distribution of similarity scores for near (top histograms) and far (bottom histograms) fields in CA1 (left) and CA3 (right) cells. Most near fields were affected by wall removal, as shown by the leftward-shifted distribution of similarity scores. In contrast, CA1 far fields were relatively preserved compared with CA3 far fields, as shown by a rightward bias in the distribution of similarity scores.
Figure 4.
Figure 4.
Distribution of similarity scores (rs) as a function of field distance to the removed wall. With the exception of near fields (<30 cm), similarity scores were consistently lower for CA3 than for CA1.
Figure 5.
Figure 5.
Examples of firing field alterations during shortcut behavior. Each row displays the firing of one cell across the three sessions of a recording sequence in the three leftmost columns (cells 1–10 have near fields, whereas cells 11–15 have far fields). Each panel shows all the paths for the recording session, with red dots indicating the spikes from one neuron. The schematic map of the maze for each recording sequence (rightmost column) shows shortcut location (dashed red circle). Marked changes in firing can be observed in session 2 (shortcut), although paths in the standard and shortcut sessions are often overlapping. This is particularly evident when the rat erroneously takes the long path instead of the shortcut. Although firing patterns are often similar in the two standard sessions bracketing the shortcut session, there is occasionally evidence for an influence of the shortcut on the last standard session. This hysteresis effect is apparent, although paths look very similar in the two standard sessions (e.g., cells 11 and 13).
Figure 6.
Figure 6.
Firing rate maps for representative place cells recorded in the control condition. The color code is as in Figure 2. For each recording sequence, a schematic map of the maze is provided showing the location in the maze in which an opaque maze section was substituted with a transparent section. None of the fields were significantly affected by such substitution.
Figure 7.
Figure 7.
Distribution of similarity scores during standard sessions. Although the fields that were unaffected during the shortcut session were usually highly similar in the two standard sessions that bracketed the shortcut session (top histograms), some of the fields affected by the shortcut were not completely restored in the last standard session, as shown by the leftward-shifted distribution of similarity scores (bottom histograms).

References

    1. Agster KL, Fortin NJ, Eichenbaum H. The hippocampus and disambiguation of overlapping sequences. J Neurosci. 2002;22:5760–5768. - PMC - PubMed
    1. Ainge JA, Tamosiunaite M, Woergoetter F, Dudchenko PA. Hippocampal CA1 place cells encode intended destination on a maze with multiple choice points. J Neurosci. 2007;27:9769–9779. - PMC - PubMed
    1. Barry C, Burgess N. Learning in a geometric model of place cell firing. Hippocampus. 2007;17:786–800. - PubMed
    1. Battaglia FP, Treves A. Attractor neural networks storing multiple space representations: a model for hippocampal place fields. Phys Rev E. 1998;58:7738–7753.
    1. Bower MR, Euston DR, McNaughton BL. Sequential-context-dependent hippocampal activity is not necessary to learn sequences with repeated elements. J Neurosci. 2005;25:1313–1323. - PMC - PubMed

Publication types

LinkOut - more resources