Comparative Study
. 2008 Jul 16;28(29):7376-86.
doi: 10.1523/JNEUROSCI.1135-08.2008.

Functional topography and integration of the contralateral and ipsilateral retinocollicular projections of ephrin-A-/- mice

Affiliations
Comparative Study

Functional topography and integration of the contralateral and ipsilateral retinocollicular projections of ephrin-A-/- mice

Daniel J Haustead et al. J Neurosci. .

Abstract

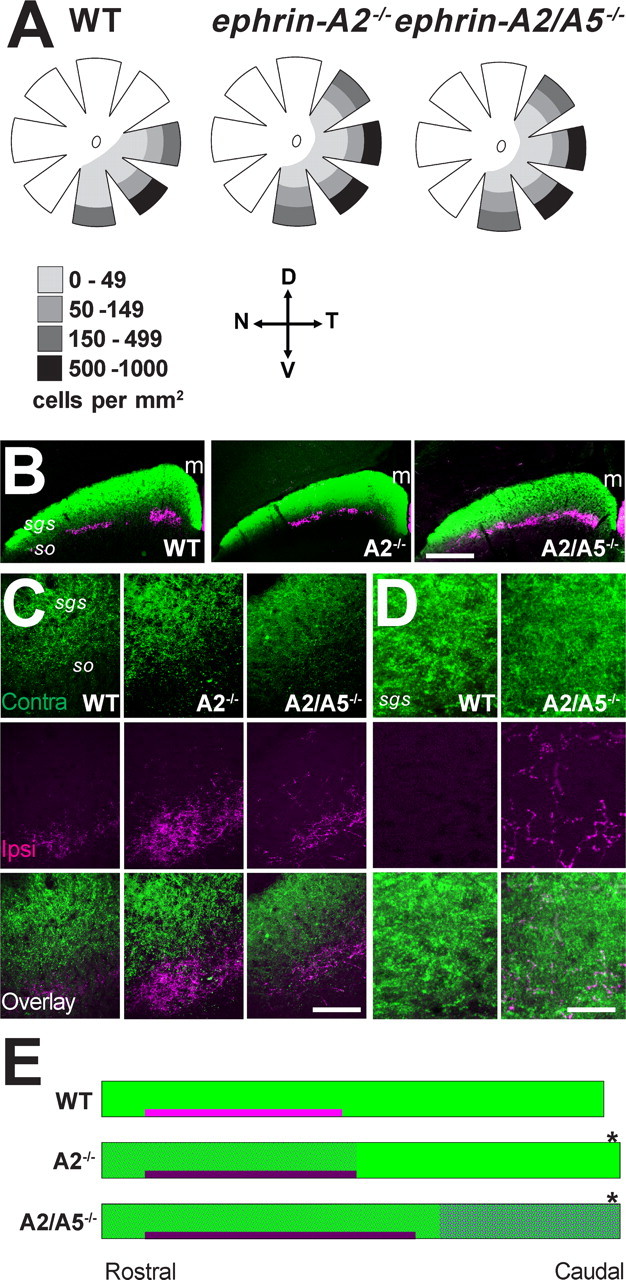
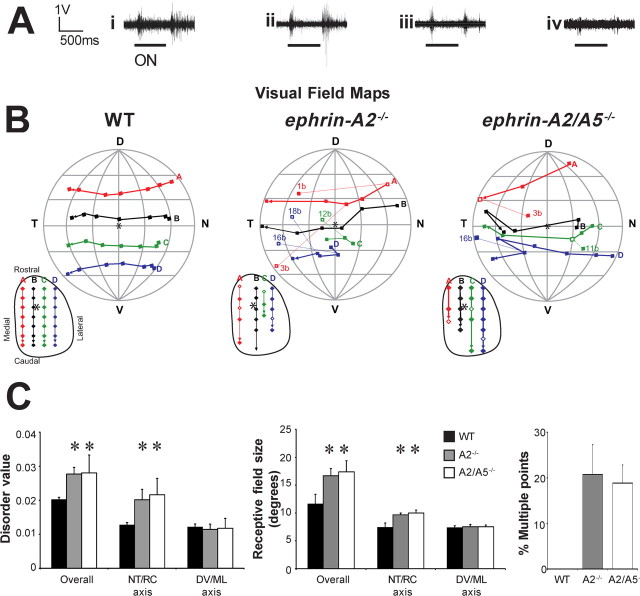
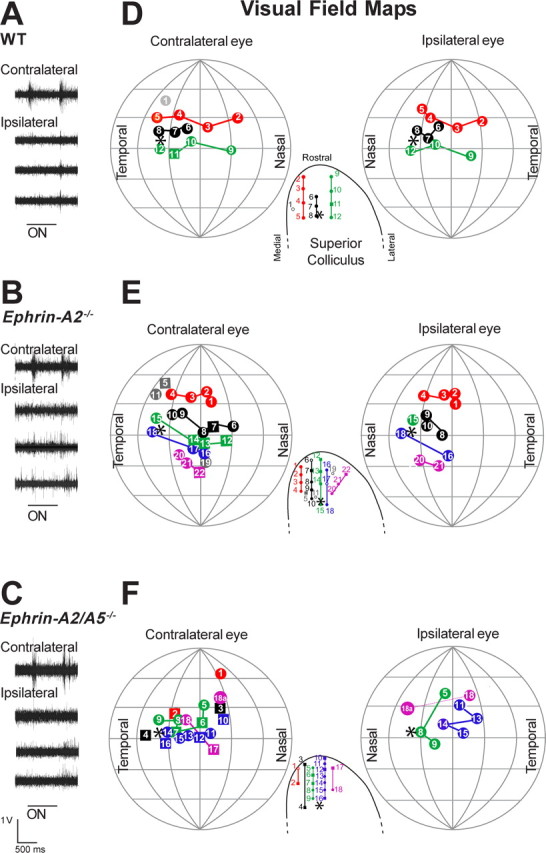
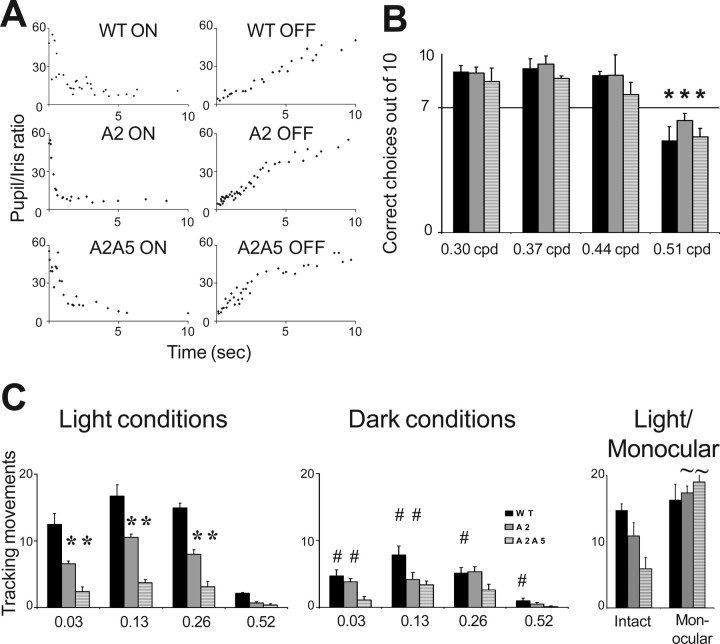
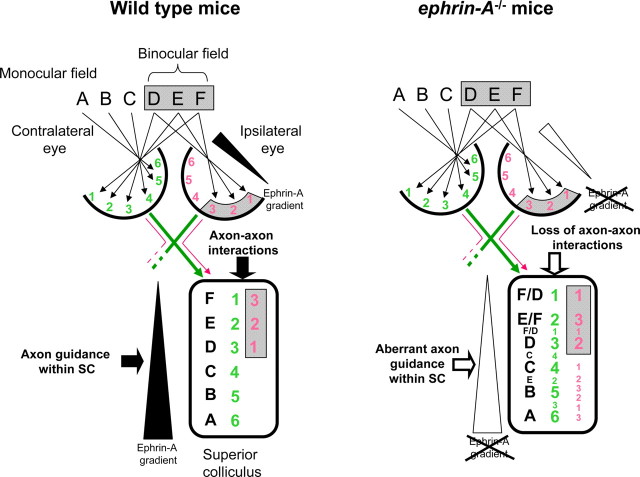
Topographically ordered projections are established by molecular guidance cues and refined by neuronal activity. Retinal input to a primary visual center, the superior colliculus (SC), is bilateral with a dense contralateral projection and a sparse ipsilateral one. Both projections are topographically organized, but in opposing anterior-posterior orientations. This arrangement provides functionally coherent input to each colliculus from the binocular visual field, supporting visual function. When guidance cues involved in contralateral topography (ephrin-As) are absent, crossed retinal ganglion cell (RGC) axons form inappropriate terminations within the SC. However, the organization of the ipsilateral projection relative to the abnormal contralateral input remains unknown, as does the functional capacity of both projections. We show here that in ephrin-A(-/-) mice, the SC contains an expanded, diffuse ipsilateral projection. Electrophysiological recording demonstrated that topography of visually evoked responses recorded from the contralateral superior colliculus of ephrin-A(-/-) mice displayed similar functional disorder in all genotypes, contrasting with their different degrees of anatomical disorder. In contrast, ipsilateral responses were retinotopic in ephrin-A2(-/-) but disorganized in ephrin-A2/A5(-/-) mice. The lack of integration of binocular input resulted in specific visual deficits, which could be reversed by occlusion of one eye. The discrepancy between anatomical and functional topography in both the ipsilateral and contralateral projections implies suppression of inappropriately located terminals. Moreover, the misalignment of ipsilateral and contralateral visual information in ephrin-A2/A5(-/-) mice suggests a role for ephrin-As in integrating convergent visual inputs.


Figures

Figure 1.
Figure 1.
Anatomy of bilateral retinocollicular projections in ephrin-A−/− mice. A, Diagrams of retinal wholemounts retrogradely labeled with fluorogold to characterize the ipsilateral projection. Data are taken from Tables 1 and 2. Ipsilaterally projecting RGCs are distributed within a ventrotemporal crescent and are more densely packed in peripheral compared with central retina. In ephrin-A−/− mice the distribution of the ipsilaterally projecting RCGs extended into the dorso-lateral retina. Legend shows the density of cells per 1 mm2. D, Dorsal retina; V, ventral retina; T, temporal retina; N, nasal retina. B–D, Coronal sections of the rostral SC showing anterogradely labeled axon terminals of contralateral (green) and ipsilateral (magenta) retina projections to the SC. m, Midline. Sections containing the highest density of ipsilateral terminals are shown at low (B) and high (C) magnification. D, Caudal-most section of the SC, note diffuse ipsilateral projections in ephrin-A2/A5−/− mice. Scale bars: B, 500 μm; C, 100 μm; D, 50 μm. E, A schematic diagram representing the rostrocaudal extent (left to right) of the superficial layers of the SC. Data from Tables 1 and 2 were used to create the diagram. The green bar represents terminals from the contralateral eye and the magenta bar, the more deeply placed terminations of ipsilateral RCGs. The darker shade of magenta in ephrin-A−/− mice reflects the more dense projections. Magenta shading in ephrin-A−/− SCs represents the distribution and density of diffuse ipsilateral terminals illustrated in C and quantified in Table 2. Note the total length of the SC is greater in ephrin-A−/− mice (asterisk) and the rostrocaudal extent of the SC occupied by ipsilateral terminals is extended in ephrin-A2/A5−/− mice.
Figure 2.
Figure 2.
Functional topography of the contralateral retinocollicular projection. A, Traces showing typical multiunit responses to lights-on and lights-off recorded from the superficial contralateral SC of WT and ephrin-A−/− mice. i–iii, Responses from topographically appropriate locations in WT (i), ephrin-A2−/−, (ii) and ephrin-A2/A5−/− mice (iii). iv, Response from a topographically inappropriate location in an ephrin-A2/A5−/− mouse (point 3b in the ephrin-A2/A5−/− map in B). B, The representation of the contralateral visual field in the SC of WT and ephrin-A−/− mice. Diagrams are representative maps recorded from a single animal. The visual field is viewed as if facing the mouse and the projection of the optic disc (asterisk) was at the center (the intersection of the vertical and horizontal axes). Meridians and parallels are shown at 30° intervals. D, Dorsal visual field; V, ventral visual field; T, temporal visual field; N, nasal visual field. Filled squares represent the center of visual fields recorded via the contralateral eye. In ephrin-A−/− mice, some SC locations received input from more than one receptive field. The strongest input is represented by a filled square. The weaker inputs are represented by hollow squares and are identified by a number and letter to denote the relative strength (B > C). The locations of the corresponding electrode penetrations in the SC are shown as an inset below and to the left of each map. Locations that received a single input are shown by filled diamonds, whereas those with multiple inputs are represented by hollow diamonds. SC locations are plotted from stereotaxic coordinates and are shown in relation to the borders of the SC, and the predicted location of the optic disc (asterisk). M, Medial; L, lateral; R, rostral; C, caudal. Receptive fields and SC locations are joined by colored lines to facilitate qualitative assessment of topographic order. When multiple receptive fields are present, the most topographically appropriate input is included in the rows regardless of strength. Note that the topographically appropriate point, when present, does not always elicit the strongest response (e.g., ephrin-A2−/−, point 1; ephrin-A2/A5−/−, point 11). C, Histograms showing quantitative analysis of topographic maps, averaged for three to six animals per genotype. The amount of disorder was analyzed for each map as a whole (overall values) and for the nasotemporal retinal/rostrocaudal SC and dorsoventral retinal/mediolateral SC axes separately. Overall disorder represents the absolute distance between the predicted location of a visual field point (based on the SC location) and its actual location (overall values). Axis-specific measurements assess only the differences in that axis. High values represent high disorder. Receptive field size was averaged for all points recorded in each animal, and then averaged between animals to obtain the graphed value. The “overall” value represents the angle in visual space that would be occupied by a circle of the same area as the receptive field. The nasotemporal retinal/rostrocaudal SC and dorsoventral retinal/mediolateral SC measurements show the average RF span for each axis. The number of multiple points is expressed as a percentage of the total points recorded from each animal in that group. Error bars indicate SEM. Significant differences compared with WT are shown with an asterisk.
Figure 3.
Figure 3.
Functional topography of the ipsilateral retinocollicular projection. A–C, Traces showing typical multiunit responses to lights-on and lights-off recorded from the superficial rostral ipsilateral SC of WT (A), ephrin-A2−/− (B) and ephrin-A2/A5−/− (C) mice. D–F, Representation of the frontal visual field in the SC of WT and ephrin-A−/− mice. Diagrams show composite maps recorded from three animals per genotype. To allow comparison between animals, receptive fields of individual mice were translated to bring the optic disk of each eye to a standard position of 40° lateral and 0° vertical. The lateral translation enabled the binocular fields of both eyes to be optimally represented across the full extent of the projection sphere. The organization of receptive fields is shown separately for each eye with contralateral on the left and ipsilateral on the right. For both, the field coordinate system is as in Figure 1, but the mouse was oriented with the nose pointing directly at the center of the hemisphere to map the frontal visual field. Meridians and parallels are shown at 30° intervals. D, Dorsal visual field; V, ventral visual field; T, temporal visual field; N, nasal visual field. Insets representing the SC are the same as in Figure 1 but enlarged to represent the rostral region. The optic disc and its projection are indicated by an asterisk. Receptive fields and SC locations are joined by colored lines to facilitate qualitative assessment of topographic order. Electrode penetrations that fell outside of a row are in gray. Individual receptive fields are numbered to show the relative locations of contralateral and ipsilateral fields, and to allow identification of the corresponding electrode penetration in the SC. Solid squares represent receptive fields that were purely contralateral. Solid circles with the same number represent contralateral and ipsilateral responses recorded from the same SC penetration, but at different depths (see Materials and Methods). Empty circles in the SC represent electrode penetrations from which an ipsilateral response was recorded, but could not be accurately mapped because of the weakness of the response, or habituation. A secondary receptive field was detected in one ephrin-A2/A5−/− mouse (point 18). Secondary fields were present in both contralateral and ipsilateral projections and are indicated by the letter “a” and joined to the stronger point by a dotted line.
Figure 4.
Figure 4.
Visually evoked behavior. A, Pupillary response to lights on and off stimuli in WT, ephrin-A2−/−, and ephrin-A2/A5−/− mice. Light stimulus was given at time 0. Complete pupil constriction and dilatation occurred within 5–6 s for all genotypes. B, Visual acuity in WT, ephrin-A2−/−, and ephrin-A2/A5−/− mice shown as the percentage (mean ± SEM) of correct choices in the Y-shaped maze. The x-axis shows the spatial frequencies (cycles per degree) tested. All mice performed to criterion (70%) up to the spatial frequency of 0.51 cpd, when performance dropped to ∼50% (performance at 0.44 cpd compared with 0.51 cpd: WT, p < 0.0001; ephrin-A2−/−, p = 0.0001; ephrin-A2/A5, p = 0.0008). There were no significant differences between genotypes for the limit of visual acuity (p > 0.05). C, Histograms showing head tracking response (mean ± SEM) of control (WT), ephrin-A2−/−, and double ephrin-A2/A5−/− mice in an optokinetic drum rotating at 2 rpm. The x-axis shows the spatial frequencies (cycyles per degree) tested. Under light conditions (1000 lux), significant differences were observed between genotypes: knock-out genotypes displayed significantly fewer tracking movements compared with WT at all spatial frequencies except 0.52 cpd. *Significant differences (p < 0.05) compared with WT. Ephrin-A2−/− mice were also significantly more responsive than ephrin-A2/A5−/−. In reduced light conditions (300 lux), when all mice had suboptimal visual conditions, the number of tracking movements was significantly reduced compared with light conditions in WT at all spatial frequencies and in ephrin-A2−/− mice at 0.03 and 0.13 cpd. #Significant differences (p < 0.05) compared with light conditions. In contrast, responses in ephrin-A2/A5−/− mice were similar under dim and bright light conditions (p > 0.05). Monocular tracking responses at 0.13 cpd in light conditions were normal for WT mice, but ephrin-A−/− mice made significantly more tracking movements than their binocular counterparts so that they were no longer different from WT controls. Significant differences between monocular and binocular responses of the same genotype (intact).
Figure 5.
Figure 5.
Summary diagram. Diagrammatic representation of the relationship between the ipsilateral and contralateral retinal projections, and the resulting representation of visual field information in WT (left) and ephrin-A−/− mice. Letters represent visual field information and numbers represent RGCs within the retina and their terminations within the SC. In WT mice, the ipsilateral and contralateral retinal axons (numbers) project in reverse orientation relative to each other within the SC, providing a continuous representation of the binocular visual field (letters). In contrast, in mice lacking ephrin-A2 and ephrin-A5, the contralateral and ipsilateral projections are disordered within themselves and relative to each other: the contralateral projection retains gross topographic order, but shows some errors and the presence of weaker multiple projections (small numbers) (Feldheim et al., 2000; present study). The ipsilateral projection is also disordered with duplicated projections. The functional representation of the visual field within the SC is thus incorrect with contralateral and ipsilateral input no longer aligned (different letters at the same SC location) and duplicated information (small letters).

References

    1. Balkema GW, Jr, Pinto LH, Dräger UC, Vanable JW., Jr Characterisation of abnormalities in the visual system of the mutant mouse pearl. J Neurosci. 1981;1:1320–1329. - PMC - PubMed
    1. Cang J, Kaneko M, Yamada J, Woods G, Stryker MP, Feldheim DA. Ephrin-As guide the formation of functional maps in the visual cortex. Neuron. 2005;48:577–589. - PMC - PubMed
    1. Cang J, Niell CM, Liu X, Pfeiffenberger C, Feldheim DA, Stryker MP. Selective disruption of one Cartesian axis of cortical maps and receptive fields by deficiency in ephrin-As and structured activity. Neuron. 2008;57:511–523. - PMC - PubMed
    1. Caras IW. A link between axon guidance and axon fasciculation suggested by studies of the tyrosine kinase receptor EphA5/REK7 and its ligand ephrin-A5/AL-1. Cell Tissue Res. 1997;290:261–264. - PubMed
    1. Cheng HJ, Nakamoto M, Bergemann AD, Flanagan JG. Complementary gradients in expression and binding of ELF-1 and Mek4 in development of the topographic retinotectal projection map. Cell. 1995;82:371–381. - PubMed

Publication types

MeSH terms

LinkOut - more resources