Comparative Study
. 2008 Jul 16;28(29):7412-25.
doi: 10.1523/JNEUROSCI.0581-08.2008.

The time course of transmitter at glycinergic synapses onto motoneurons

Affiliations
Comparative Study

The time course of transmitter at glycinergic synapses onto motoneurons

Marco Beato. J Neurosci. .

Abstract

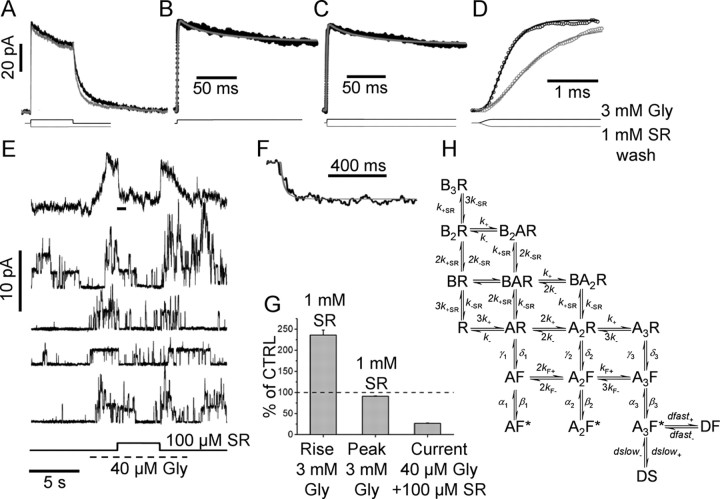
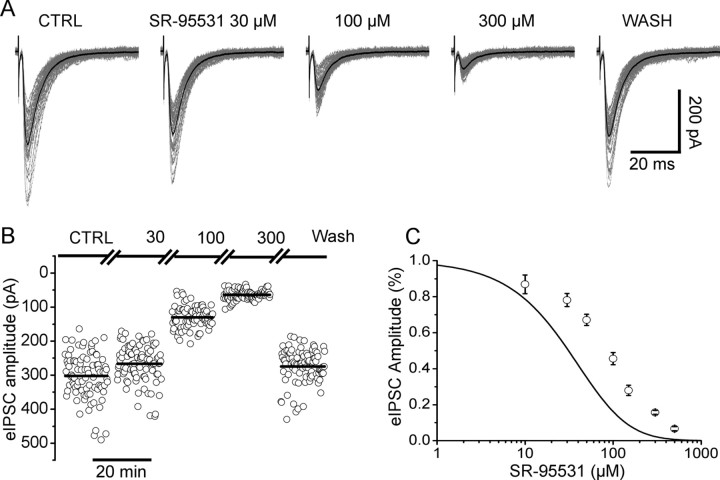
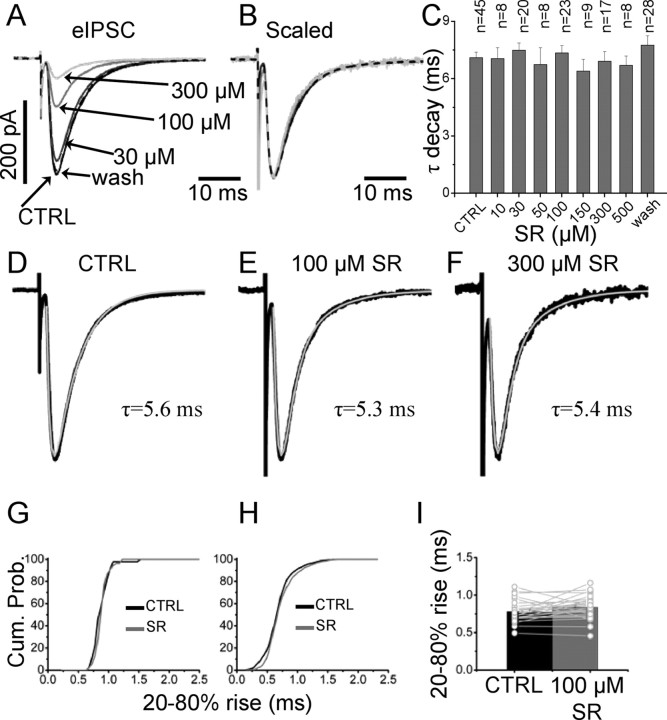
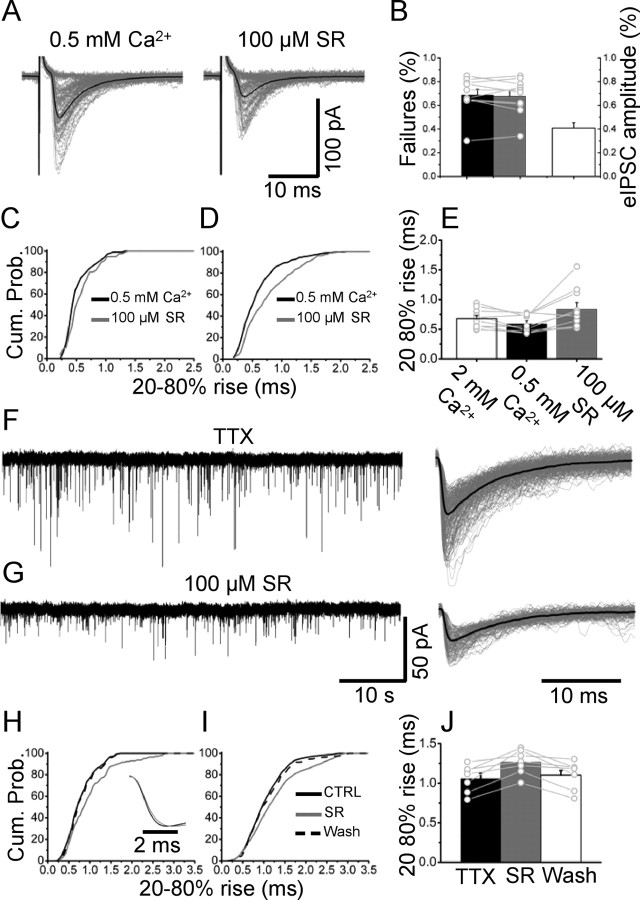
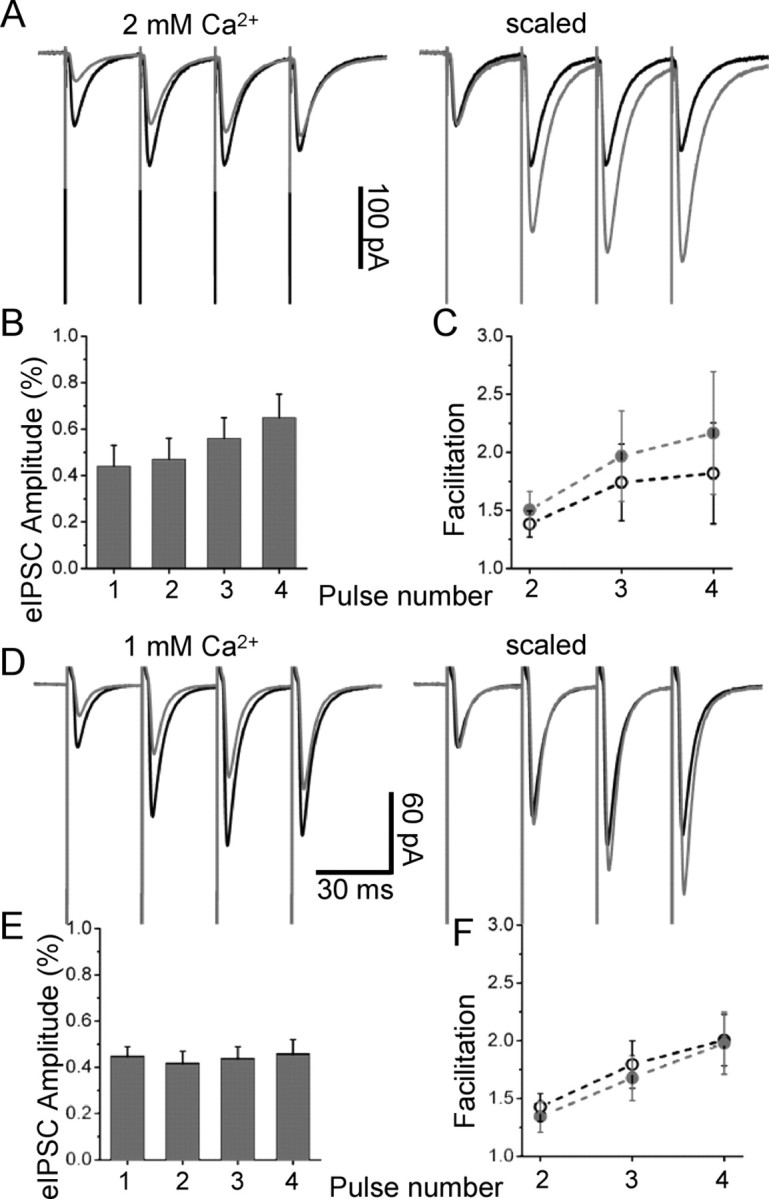
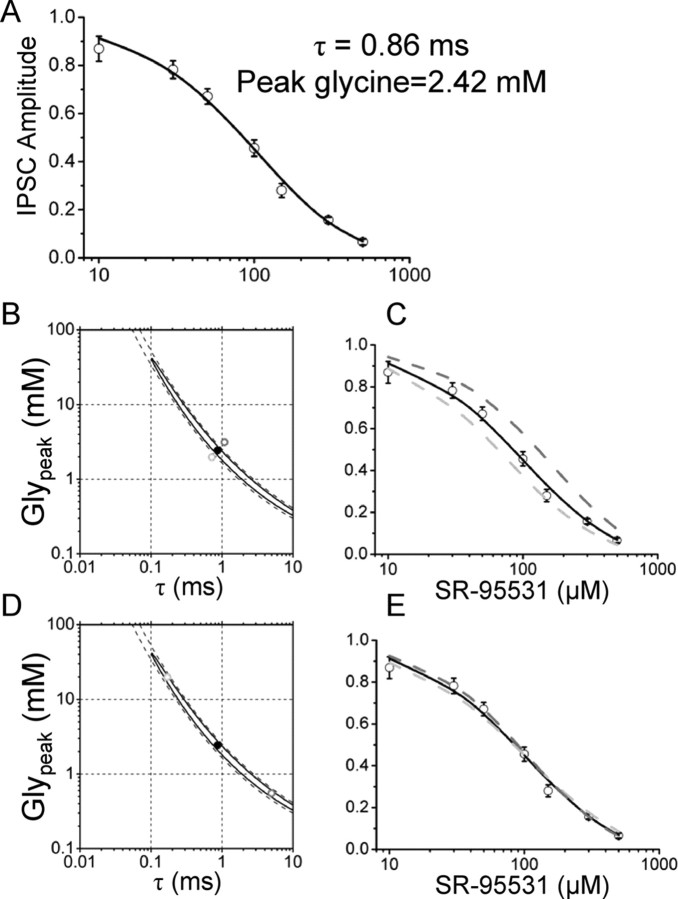
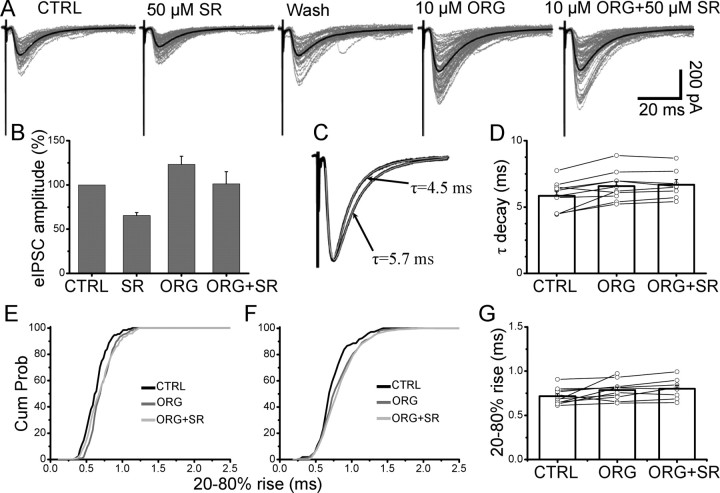
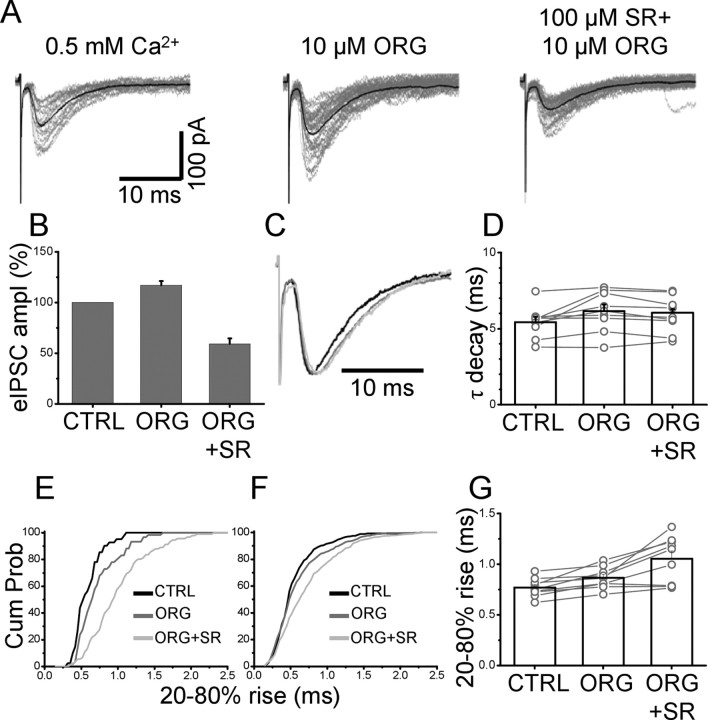
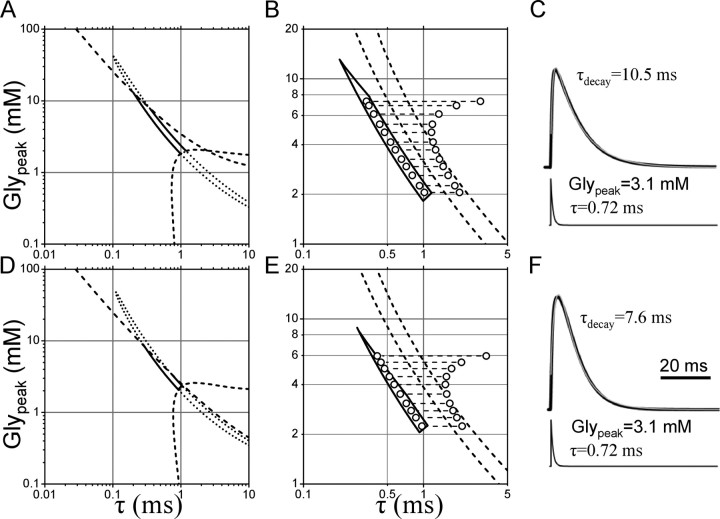
The concentration of transmitter in the synaptic cleft and its clearance time are one of the main determinants of synaptic strength. We estimated the time course of glycine at rat lumbar motoneurons synapses in spinal cord slices by recording synaptic currents in the presence of a low-affinity competitive antagonist at glycine receptors [2-(3-carboxypropyl)-3-amino-6-(4-methoxyphenyl)pyridazinium (SR-95531)]. Data were analyzed by using the established activation mechanism for glycine receptors and our measurements of SR-95531 binding rates. We show that this technique alone is not sufficient to determine simultaneously the peak concentration of transmitter and its clearance time. However, we found that block of the glial glycine transporter prolongs the glycine transient. This observation puts additional constraints on the range of possible values of the time course of glycine, indicating that glycine reaches a peak concentration of 2.2-3.5 mM and is cleared from the cleft with a time constant of 0.6-0.9 ms.


Figures

Figure 1.
Figure 1.
The determination of binding rates for SR-95531 from patches excised from motoneurons. A, The response to a 3 mm, 200 ms glycine application (black trace; average of 15 sweeps) is shown superimposed to the response to the same glycine pulse, but after preequilibration with 1 mm SR-95531. B–D show current responses overlapped with fits. B, The current responses were fitted to the model of H that extends the scheme by Burzomato et al. (2004) to include two desensitized states and the binding of a competitive antagonist (B). The desensitization rates from states DF and DS were free variables [all the other rates were fixed to the values determined in the study by Burzomato et al. (2004)]: α1 = 3400, β1 = 4200, α2 = 2100, β2 = 28,000, α3 = 7000, β3 = 129,000, γ1 = 29,000, δ1 = 180, γ2 = 18,000, δ2 = 6800, γ3 = 900, δ3 = 20,900, k = 300, k+ = 0.59 × 10⁶, kF− = 1200, kF+ = 150 × 106 (all in s−1 or m−1s−1, where appropriate). B, The continuous gray line shows the fit to the data (black dots) in control obtained by optimizing the four desensitization rates. The same desensitization rates give a good description of the current trace after wash of SR-95531 (C). D, Expanded timescale of the rising phase of the response in control (black dots) and after preincubation and wash of SR-95531 (gray dots). The response after wash of the antagonist is slowed down. The rising phase of the control response was fitted using the k+ for glycine as a free parameter (black continuous line). Once k+ was determined, all rates were fixed and the two traces were simultaneously fitted using k−SR as the only free parameter (continuous gray line). E, The four individual sweeps (bottom traces) show single-channel activity in the presence of 40 μm glycine and the effect of jumping into 100 μm SR-95531 (indicated by the step below the current traces). SR-95531 at 100 μm reduces the frequency and duration of the single-channel activation. Note that glycine was applied by simply switching on the perfusion line within the double barrel of the theta tube, and therefore some variability in the timing of the application results in channels opening well before the application of the antagonist (see, for example, the first individual sweep). The top trace in E is the average of 26 individual sweeps. The timescale expansion of the part of the averaged trace indicated by the horizontal bar is shown in F (black line) superimposed to a fit obtained by keeping all the rate constants fixed to the average values determined previously and using only k+SR as a free parameter. The bar plot in G shows the increase in rise time and decrease in peak current induced by preincubation with 1 mm SR-95531 (expressed as percentage of control) and the 27% residual current in the presence of 40 μm glycine and 100 μm SR-95531. Error bars indicate SDM.
Figure 2.
Figure 2.
The effect of SR-95531 on evoked glycinergic IPSCs. A shows the evoked responses in control (left) and in the presence of increasing concentrations of SR-95531. Individual sweeps (>50) are shown in gray, superimposed to the average IPSC (in black). The amplitude of individual responses is shown in B for the three concentrations of SR-95531 tested in this cell. Complete wash of the antagonist was achieved after 5 min. C shows the experimental dose–inhibition curve obtained pooling data from 45 cells. The continuous line is the dose inhibition calculated from the equilibrium constant (KB = 120 μm). The discrepancy between the equilibrium curve and the observed data indicates that significant unbinding of the antagonist occurs during the pulse of synaptically released glycine. Error bars indicate SDM.
Figure 3.
Figure 3.
SR-95531 does not alter the time course of eIPSCs. A, Average eIPSCs in control and in the presence of three concentrations of SR-95531 are shown in A. B, C, Overlap of the scaled traces (B) shows that there is no difference in the decay time of the evoked IPSC at different antagonist concentrations (summarized in the bar plot in C for all the concentrations tested; error bars indicate SDM). D–F, The fit of the evoked responses to an exponential pulse function with a single exponential decay and rise (see Materials and Methods). Cumulative distribution of the individual rise times in control (black line) and in the presence of 100 μm SR-95531 (gray line) are shown in G. H, No significant differences in rise times were observed when the cumulative distributions of each cell were pooled together (n = 23). Cum. Prob., Cumulative probability. I, Summary of the average of individual rise times for each experiment in the presence of 100 μm SR-95531. The black and gray bars are the average of 23 experiments in control and with 100 μm SR-95531, respectively.
Figure 4.
Figure 4.
The effect of SR-95531 on eIPSCs at low release probability. A, IPSC were evoked with a reduced (0.5 mm) concentration of Ca2+ in control (left) and in the presence of 100 μm SR-95531 (right). B, In these conditions, the failure rate was typically ∼60% and was not affected by application 100 μm SR-95531 (black and gray bars). The amplitude of the evoked events was reduced by the same amount as in control conditions (white bar). Lowering Ca2+ decreased the rise time of evoked events (E, white and black bars). Application of 100 μm SR-95531 in conditions of lowered release probability increased the rise time of individual events, as shown by the cumulative distribution in C. This effect was significant across cells (pooled distribution of rise times in D and individual and average values in E, black and gray bars; n = 10). F, G, Continuous recording of quantal events before (F) and after (G) application of 100 μm SR-95531 (individual sweeps and their average are shown on the right of each trace). The rise time of individual events is prolonged by the antagonist, as shown for one cell in H. Cum. Prob., Cumulative probability. The pooled distributions in seven cells and their individual and average values of rise time are reported in I and J, respectively. Error bars indicate SDM.
Figure 5.
Figure 5.
SR-95531 does not have presynaptic effects. A shows paired-pulse facilitation over four stimulations (every 30 ms) in control (black trace; average of 64 sweeps) and in the presence of 100 μm SR-95531 (gray trace; average of 96 sweeps). B, C, As shown in the scaled average (right) and in the bar chart (B), the facilitated pulses are inhibited less than the first one, and as a consequence the paired-pulse ratio for the four consecutive eIPSCs increases in the presence of SR-95531 (C). The paired-pulse ratios in control (black circle) and in the presence of SR-95531 (gray circles) were significantly different for the third and fourth pulses in the train. D–F, In conditions of low release probability (1 mm Ca2+/3 mm Mg2+), the increase in paired-pulse facilitation was abolished (D) (average of >100 sweeps) for all the pulses in the train (F, plot), and each pulse in the train was inhibited by the same amount (E), suggesting that, in conditions in which multivesicular release is less likely, SR-95531 does not increase the probability of release. Error bars indicate SDM.
Figure 6.
Figure 6.
Fitting the dose–inhibition curve of eIPSC does not determine the values of Glypeak and τ. The dose inhibition of Figure 2C was fitted by solving the equations for the scheme of activation of GlyRs using as free parameters the values of Glypeak and τ that determine the concentration and clearance time of glycine in the cleft. A, Values of Glypeak = 2.4 mm and τ = 0.86 ms provide a satisfactory fit of the data points. B shows the 95% (continuous line) and 99% (dashed line) confidence interval for the estimate of the two free parameters. The region of confidence extends over two orders of magnitude for both Glypeak and τ. The calculated dose–inhibition curve corresponding to the best fit is shown again in C as a black line, superimposed to the calculated curves for values of Glypeak and τ slightly above (B, dark gray dot; C, dark gray dashed line) or below (light gray dot and curve in B and C, respectively) the confidence region. As shown, even a small variation outside the confidence region produces a poor fit of the experimental data. However, when values of Glypeak and τ were chosen within the confidence region but very far from the estimated values (D, light and dark gray dots), the calculated dose–inhibition curves (E, in light and dark gray) were not significantly different from the one corresponding to the best estimate for Glypeak and τ. Error bars indicate SDM.
Figure 7.
Figure 7.
The effect of block of the glial glycine transporter on the evoked IPSCs. A, Evoked IPSC in control were inhibited by 35%. After wash, ORG-24598 was applied. This resulted in an increase in the amplitude of eIPSCs. Subsequent application of 50 μm SR-95531 resulted in a reduced inhibition of the eIPSC (14% of its value with ORG-24598 alone). The overall effect of ORG-24598 on the amplitude of eIPSC with and without 50 μm SR-95531 is shown in B. Block of the glycine glial transporter strongly reduces the inhibition induced by 50 μm SR-95531, indicating that the transporter has a role in determining the time course of glycine in the cleft. Error bars indicate SDM. C, The average eIPSC in the presence of ORG-24598 (superimposed to the scaled eIPSC in control) has a prolonged decay time that is fitted with a single exponential with time constant of 5.7 ms. D, Application of 50 μm SR-95531 failed to change the decay time in all the cells tested. E, The eIPSCs rise time increased in the presence of ORG-24598 (compare black and dark gray lines) but did not change when 50 μm SR-95531 and ORG-24598 were subsequently applied (G, light gray line). F, Pooled cumulative distribution of rise times for 10 cells (F) and individual values in each experiment (G).
Figure 8.
Figure 8.
The eIPSC rise times are increased by both ORG-24598 and SR-95531 in conditions of low release probability. A, Individual eIPSCs (with their average superimposed and failures omitted) in 0.5 mm Ca2+ and after perfusion with ORG-24598 (middle) and 100 μm SR-95531 (right). B, ORG-24598 enhances the response, which is inhibited by 100 μm SR-95531 less than in control conditions (bar chart). Error bars indicate SDM. C, D, Overlap of average traces (C) shows that the decay time is prolonged by application of ORG-24598 (dark gray) and is not changed by SR-95531 (light gray; individual values in D). E, The eIPSC rise time is prolonged by ORG-24598 (dark gray) and further prolonged by 100 μm SR-95531 (light gray). This is summarized in the pooled distributions from nine cells (F) and the individual values in G.
Figure 9.
Figure 9.
The values of Glypeak and τ can be determined by combining the experimental dose–inhibition curve with the observation of the increase in amplitude induced by block of the glial glycine transporter. The continuous line in A represents the 95% confidence limits in the estimate of Glypeak and τ. The dashed line in the bottom corner of the plot delimits the area below which the rise time of the calculated IPSC would be >1 ms, therefore limiting the acceptable values of Glypeak and τ to the region above the dashed line. The dashed line at the top of the plot indicates the region in which the amplitude of the calculated current is >80% of its maximum value. The intersection of this line with the 95% confidence region restricts the permitted value of Glypeak and τ to points below the dashed line to account for the observed >20% increase in amplitude of eIPSC induced by the block of the glycine transporter. B shows the resulting confidence region on an expanded scale. The increase in τ needed to increase the calculated peak current by 23% is shown by the length of the dashed lines joining the dots taken within the confidence region for Glypeak and τ. To account for the experimental results, the rightmost dots should give rise to calculated IPSCs that are 22 ± 5% inhibited by 50 μm SR-95531 (corresponding to the region delimited by the two dashed lines in B). C shows the time course of an IPSC calculated from the concentration profile of glycine shown at the bottom of the trace and the rates of the model in Figure 1H. The calculated IPSC is filtered at 500 Hz and fitted with a single exponential pulse function. The same analysis was performed using the model of Figure 1H without the extra desensitized states. The 95% confidence region comprises an area similar to the one shown above (compare D with A). Only the line delimiting the region corresponding to amplitude values <80% of the maximum is slightly shifted with respect to the one calculated in A. However, this does not affect the shape and boundaries of the remaining confidence region (shown on an expanded scale in E). Only values of Glypeak < 3.5 mm and τ > 0.6 ms can predict the 23% increase in amplitude observed with ORG-24598 together with the 22% inhibition observed with 50 μm SR-95531. F, Same as in C, but with desensitized states omitted.

References

    1. Barbour B, Häusser M. Intersynaptic diffusion of neurotransmitter. Trends Neurosci. 1997;20:377–384. - PubMed
    1. Barbour B, Keller BU, Llano I, Marty A. Prolonged presence of glutamate during excitatory synaptic transmission to cerebellar Purkinje cells. Neuron. 1994;12:1331–1343. - PubMed
    1. Beato M, Sivilotti LG. Single-channel properties of glycine receptors of juvenile rat spinal motoneurones in vitro. J Physiol. 2007;580:497–506. - PMC - PubMed
    1. Beato M, Burzomato V, Sivilotti LG. The kinetics of inhibition of rat recombinant heteromeric alpha1beta glycine receptors by the low-affinity antagonist SR-95531. J Physiol. 2007;580:171–179. - PMC - PubMed
    1. Bradaia A, Schlichter R, Trouslard J. Role of glial and neuronal glycine transporters in the control of glycinergic and glutamatergic synaptic transmission in lamina X of the rat spinal cord. J Physiol. 2004;559:169–186. - PMC - PubMed

Publication types

MeSH terms