

Causal directed acyclic graphs and the direction of unmeasured confounding bias
- PMID: 18633331
- PMCID: PMC4242711
- DOI: 10.1097/EDE.0b013e3181810e29
Causal directed acyclic graphs and the direction of unmeasured confounding bias
Abstract
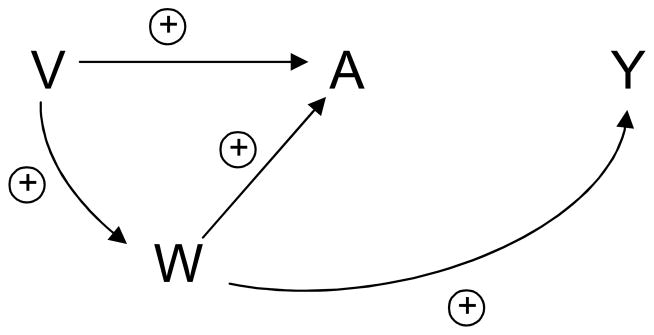
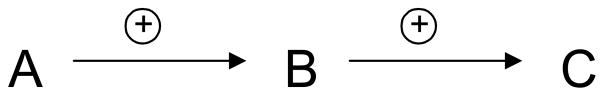
We present results that allow the researcher in certain cases to determine the direction of the bias that arises when control for confounding is inadequate. The results are given within the context of the directed acyclic graph causal framework and are stated in terms of signed edges. Rigorous definitions for signed edges are provided. We describe cases in which intuition concerning signed edges fails and we characterize the directed acyclic graphs that researchers can use to draw conclusions about the sign of the bias of unmeasured confounding. If there is only one unmeasured confounding variable on the graph, then nonincreasing or nondecreasing average causal effects suffice to draw conclusions about the direction of the bias. When there are more than one unmeasured confounding variable, nonincreasing and nondecreasing average causal effects can be used to draw conclusions only if the various unmeasured confounding variables are independent of one another conditional on the measured covariates. When this conditional independence property does not hold, stronger notions of monotonicity are needed to draw conclusions about the direction of the bias.
Figures
References
-
- Pearl J. Causal diagrams for empirical research. Biometrika. 1995;82:669–688.
-
- Greenland S, Pearl J, Robins JM. Causal diagrams for epidemiologic research. Epidemiol. 1999;10:37–48. - PubMed
-
- Robins JM. Data, design, and background knowledge in etiologic inference. Epidemiol. 2001;12:313–320. - PubMed
-
- Hernán MA, Hernández-Díaz S, Werler MM, Mitchell AA. Causal knowledge as a prerequisite for confounding evaluation: an application to birth defects epidemiology. Am J Epidemiol. 2002;155:176–184. - PubMed
-
- Cornfield J, Haenszel W, Hammond EC, Lilienfeld AM, Shimkin MB, Wynder LL. Smoking and lung cancer: Recent evidence and a discussion of some questions. Journal of the National Cancer Institute. 1959;22:173–203. - PubMed
MeSH terms
Grants and funding
LinkOut - more resources
Full Text Sources
