

Considering dependence among genes and markers for false discovery control in eQTL mapping
- PMID: 18635565
- PMCID: PMC2732206
- DOI: 10.1093/bioinformatics/btn373
Considering dependence among genes and markers for false discovery control in eQTL mapping
Abstract
Motivation: Multiple comparison adjustment is a significant and challenging statistical issue in large-scale biological studies. In previous studies, dependence among genes is largely ignored. However, such dependence may be strong for some genomic-scale studies such as genetical genomics [also called expression quantitative trait loci (eQTL) mapping] in which thousands of genes are treated as quantitative traits and mapped to different genetical markers. Besides the dependence among markers, the dependence among the expression levels of genes can also have a significant impact on data analysis and interpretation.
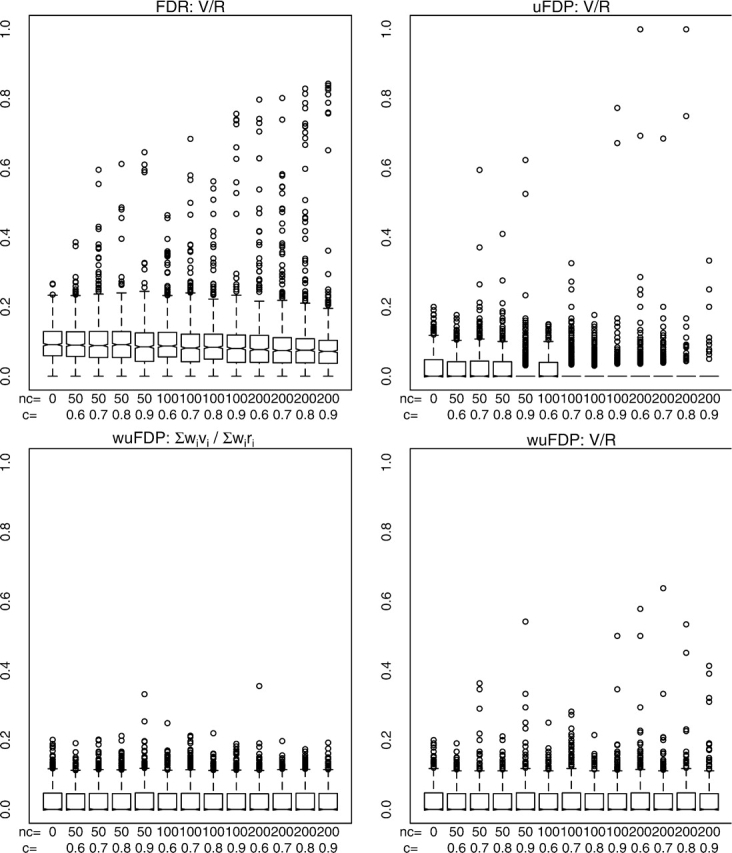
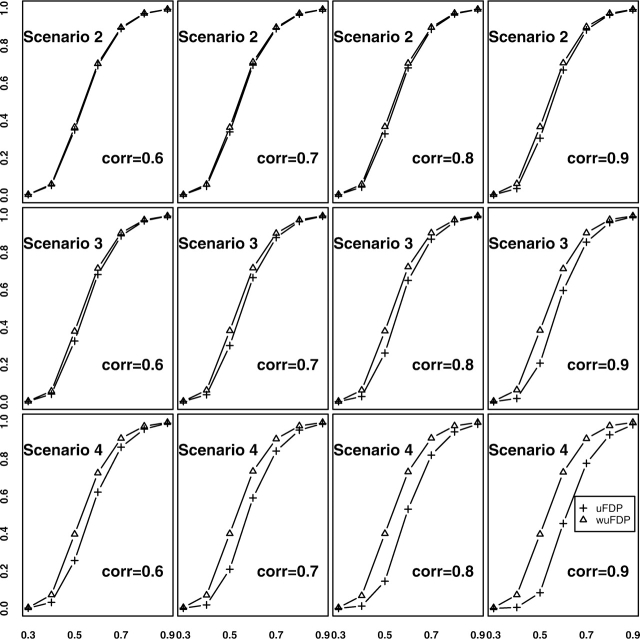
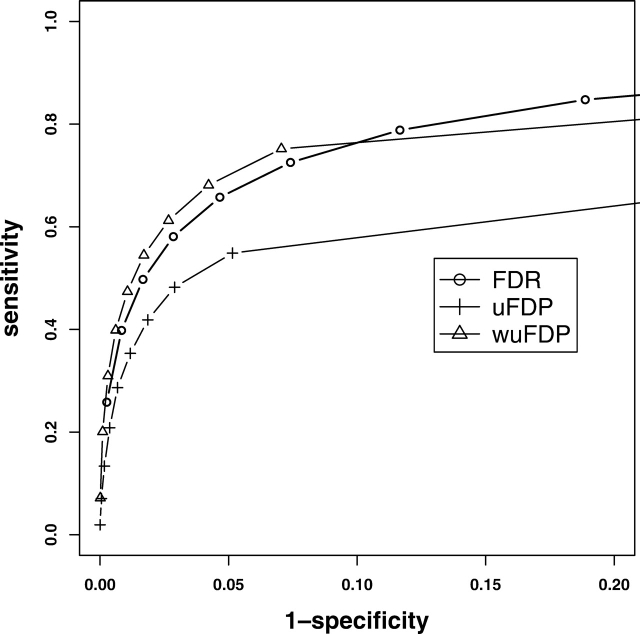
Results: In this article, we propose to consider both the mean as well as the variance of false discovery number for multiple comparison adjustment to handle dependence among hypotheses. This is achieved by developing a variance estimator for false discovery number, and using the upper bound of false discovery proportion (uFDP) for false discovery control. More importantly, we introduce a weighted version of uFDP (wuFDP) control to improve the statistical power of eQTL identification. In addition, the wuFDP approach can better control false positives than false discovery rate (FDR) and uFDP approaches when markers are in linkage disequilibrium. The relative performance of uFDP control and wuFDP control is illustrated through simulation studies and real data analysis.
Supplementary information: Supplementary figures, tables and appendices are available at Bioinformatics online.
Figures
References
-
- Benjamini Y, Hochberg Y. Controlling the false discovery rate - a practical and powerful appraoch to multiple testing. J. R. Stat. Soc. Ser. B Stat. Methodol. 1995;57:289–300.
-
- Brem R, et al. Genetic dissection of transcriptional regulation in budding yeast. Science. 2002;296:752–755. - PubMed
-
- Broman K, et al. R/qtl: Qtl mapping in experimental crosses. Bioinformatics. 2003;19:889–890. - PubMed
-
- Bystrykh L, et al. Uncovering regulatory pathways that affect hematopoietic stem cell function using “genetical genomics”. Nat. Genet. 2005;37:225–232. - PubMed
