. 2008 Oct;29(9):1722-9.
doi: 10.3174/ajnr.A1220. Epub 2008 Jul 17.

Origin of synchronized low-frequency blood oxygen level-dependent fluctuations in the primary visual cortex

Affiliations

Origin of synchronized low-frequency blood oxygen level-dependent fluctuations in the primary visual cortex

J S Anderson. AJNR Am J Neuroradiol. 2008 Oct.

Abstract

Background and purpose: Low-frequency (<0.08 Hz) fluctuations in spontaneous blood oxygen level-dependent (BOLD) signal intensity show synchronization across anatomically interconnected and functionally specific brain regions, suggesting a neural origin of fluctuations. To determine the mechanism by which high-frequency neural activity results in low-frequency BOLD fluctuations, I obtained measurements of the effects of neurovascular coupling on the frequency content of BOLD fluctuations.

Materials and methods: 3T recordings of BOLD signal intensity in the primary visual cortex were obtained in response to visual stimuli presented at varying temporal frequencies to determine which stimulus frequencies were successfully transmitted to BOLD signal intensity. Additional BOLD time series recordings were performed in a resting state and during natural visual stimulation, and frequencies comprising BOLD fluctuations were measured. Magnetoencephalographic (MEG) time series recordings were obtained in a resting state to measure which components of MEG signal intensity best correlated in frequency distribution to observed BOLD fluctuations.

Results: Visually driven oscillations in BOLD signal intensity were observed up to 0.2 Hz, representing a mismatch between low-pass filter properties of neurovascular coupling and observed frequencies of spontaneous BOLD fluctuations, which are <0.05 Hz in the primary visual cortex. Visual stimulation frequencies of >0.2 Hz resulted in frequency-dependent increases in mean BOLD response. Amplitude modulation of high-frequency neural activity was measured in MEG time series data, which demonstrated 1/frequency distribution with the greatest power comprising frequencies <0.05 Hz, consistent with the distribution of observed BOLD fluctuations.

Conclusion: Synchronized low-frequency BOLD fluctuations likely arise from a combination of vascular low-pass filtering and low-frequency amplitude modulation of neural activity.


Figures
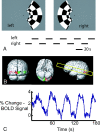
Fig 1.
Fig 1.
Selection of regions of interest. A, Visual stimuli shown to right and left hemifields corresponding to activation in left and right visual cortices. Stimuli were flashed with alternating black and white regions (100% contrast) at 6 Hz, alternating between left and right images every 20 seconds for 4 minutes. B, Activation maps in 1 subject from previously mentioned stimulation. Activation in the primary and extrastriate visual cortex is seen on the left in red and on the right in green. The yellow box on the sagittal view shows the brain region acquired for BOLD sequences. C, Left visual cortex time series. Slightly >3% increase in BOLD signal intensity is seen averaged across the left primary visual cortex cluster. Three minutes of data are shown.
Fig 2.
Fig 2.
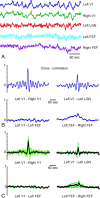
Synchronized BOLD fluctuations. A, Time series data from 1 subject. Six minutes of data are shown. Traces represent average BOLD signal intensity from regions of interest in the bilateral primary visual cortex (V1), left LGN, and bilateral frontal eye fields (FEF). B, Cross-correlation analysis represents full 14-minute resting state data from regions listed previously. Bilateral V1 shows strong focal correlation, with similar but diminished correlation between V1 and LGN. No correlation is seen between V1 and FEF. Bilateral FEF show much broader temporal correlation. C, Summary resting state BOLD cross-correlation from 6 subjects. Green traces show cross-correlograms for individual subjects, and black traces show an average cross-correlogram across subjects (bilateral V1, n = 6; left V1-left LGN, n = 3; left V1-left FEF, n = 2, left FEF-right FEF: n = 2).
Fig 3.
Fig 3.
Vascular low-pass filtering of neurovascular coupling. A, Data in the first column represent BOLD responses to a 6-Hz flashing radial checkerboard pattern turned ON and OFF at frequencies ranging from 0.01 to 0.5 Hz. Data in the second column represent BOLD responses to single flashes of 1 screen refresh duration (13 ms) of the same radial checkerboard pattern presented at frequencies ranging from 0.1 to 4 Hz. B, Peak-to-peak response for 1 period of the stimulus. Individual points plotted are responses from each subject of the amplitude of the BOLD response averaged across all cycles of stimulus presentation. Left and right hemifield responses are plotted as separate data points on the left and are averaged for each data point on the right. Error bars represent 1 standard error of the mean. C, Mean BOLD responses compared with baseline (blank screen stimulus), averaged across the entire trial for each frequency condition. Data points and error bars are as in Fig 3B.
Fig 4.
Fig 4.
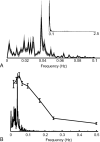
Frequencies present in spontaneous BOLD fluctuations in the primary visual cortex. A, Full-field (inset) and zoomed-in power spectra of resting-state BOLD fluctuations. Spectra are computed for each subject, normalized to the unit area under the curve, and averaged across subjects. Shaded regions represent ±1 standard error of the mean as a function of frequency. B, Superimposed vascular filtering data of Fig 3B and the resting-state power spectrum from Fig 4A. Frequencies between 0.05 and 0.2 Hz are under-represented if frequency distribution of spontaneous BOLD fluctuations arises from vascular filtering alone.
Fig 5.
Fig 5.
Power in spontaneous BOLD fluctuations in resting and visual stimulation conditions. Resting state (blue) condition shows the shift of frequency distribution to higher frequencies compared with natural visual stimulation condition (red). Spectra are averaged across 6 subjects for each condition. Shaded areas represent standard error of the mean as a function of frequency across the population. The pair-wise t test for each frequency range (0–0.02 Hz and 0.02–0.05 Hz) indicates statistically significant differences between the 2 conditions for each of the 2 ranges.
Fig 6.
Fig 6.
Amplitude modulation of MEG signal intensity. A, Procedure for calculating amplitude modulation for each frequency band of the MEG signal intensity. Raw data were first bandpass-filtered into δ, α, β, and γ bands. Data were then full-wave-rectified, and an envelope function was calculated to measure the variation in amplitude with time. Approximately 5 seconds of data are shown. B, Envelope function from Fig 6A for 1 subject. Approximately 7 minutes of data are shown. Note the similarity in appearance of low-frequency fluctuations to BOLD fluctuations shown in Fig 2.
Fig 7.
Fig 7.
The 1/frequency distribution of amplitude modulation of MEG signal intensity. A, Full-field power spectrum of unfiltered MEG signal intensity in 1 subject, resting state. Note that most of the power comprises α activity. B, The power spectrum for amplitude modulation of α activity from data in Fig 6B. A 1/frequency curve shows excellent fit to the data. C, Amplitude modulation of δ activity. Full-field power spectrum with inset showing zoomed-in region of the curve up through 0.5 Hz. Data show averages from normalized power spectra from 6 subjects. D–F, As per Fig 7C for α, β, and γ activity, also averaged from 6 subjects.

References

    1. Biswal B, Yetkin FZ, Haughton VM, et al. Functional connectivity in the motor cortex of resting human brain using echo-planar MRI. Mag Res Med 1995;34:537–41 - PubMed
    1. Maldjian JA. Functional connectivity MR imaging: fact or artifact? AJNR Am J Neuroradiol 2001;22:239–40 - PMC - PubMed
    1. Cordes D, Haughton VM, Arfanakis K, et al. Frequencies contributing to functional connectivity in the cerebral cortex in “resting-state” data. AJNR Am J Neuroradiol 2001;22:1326–33 - PMC - PubMed
    1. Birn RM, Diamon JB, Smith MA, et al. Separating respiratory-variation-related fluctuations from neuronal-activity-related fluctuations in fMRI. Neuroimage 2006;31:1536–48 - PubMed
    1. Grecius MD, Krasnow B, Reiss AL, et al. Functional connectivity in the resting brain: a network analysis of the default mode hypothesis. Proc Natl Acad Sci U S A 2003;100:253–58 - PMC - PubMed

Publication types