. 2008 Sep 1;586(17):4283-94.
doi: 10.1113/jphysiol.2008.156430. Epub 2008 Jul 17.

Movement of the tongue during normal breathing in awake healthy humans

Affiliations

Movement of the tongue during normal breathing in awake healthy humans

S Cheng et al. J Physiol. .

Abstract

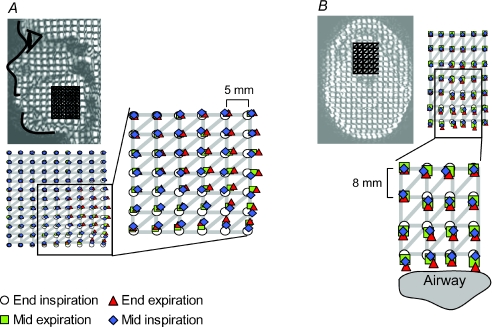
Electromyographic (EMG) activity of the airway muscles suggest that genioglossus is the primary upper airway dilator muscle. However, EMG data do not necessarily translate into tissue motion and most imaging modalities are limited to assessment of the surfaces of the upper airway. In this study, we hypothesized that genioglossus moves rhythmically during the respiratory cycle and that the motion within is inhomogeneous. A 'tagged' magnetic resonance imaging technique was used to characterize respiratory-related tissue motions around the human upper airway in quiet breathing. Motion of airway tissues at different segments of the eupnoeic respiratory cycle was imaged in six adult subjects by triggering the scanner at the end of inspiration. Displacements of the 'tags' were analysed using the harmonic phase method (HARP). Respiratory timing was monitored by a band around the upper abdomen. The genioglossus moved during the respiratory cycle. During expiration, the genioglossus moved posteriorly and during inspiration, it moved anteriorly. The degree of motion varied between subjects. The maximal anteroposterior movement of a point tracked on the genioglossus was 1.02 +/- 0.54 mm (mean +/- s.d.). The genioglossus moved over the geniohyoid muscle, with minimal movement in other muscles surrounding the airway at the level of the soft palate. Local deformation of the tongue was analysed using two-dimensional strain maps. Across the respiratory cycle, positive strains within genioglossus reached peaks of 17.5 +/- 9.3% and negative strains reached peaks of -16.3 +/- 9.3% relative to end inspiration. The patterns of strains were consistent with elongation and compression within a constant volume structure. Hence, these data suggest that even during respiration, the tongue behaves as a muscular hydrostat.


Figures

Figure 1
Figure 1. Equipment, imaging planes and effectiveness of respiratory band
A, subject in a head coil. A respiratory band is fixed around the upper abdomen by an adjustable band and is connected to a pressure transducer. Regular trigger pulses are generated using a computer. Both the pressure and trigger pulses are displayed on the same oscilloscope. The trigger pulses are also connected to the scanner. The oscilloscope shows a respiratory cycle divided into 5 equal segments by 6 trigger pulses. B, a T2-weighted image of the head in the mid-sagittal plane. The locations of the 2 axial planes were determined from the sagittal image as shown. The upper axial plane touched the tip of the soft palate and the lower axial plane touched the caudal end of the epiglottis and was positioned parallel to the mandible. C, typical relation between the pressure from the respiratory band and airflow measured at the mouth. The two vertical lines show coincidence of the airflow, volume and pressure from the respiratory band at the onset of inspiration. D, an example of how data are acquired for the 1st and 2nd segment of the respiratory cycle. After ‘pretriggering’, the acquisition of the 5 images is not immediate, but starts at the next trigger pulse. The shaded bar represents the time delay due to the laying down of tags (∼140 ms; see Methods). For both segments shown diagrammatically here, the beginning and end of the cycle, as indicated by the inspiratory peak, align with the pulses (6 pulses per breath), so the data are accepted for analysis.
Figure 2
Figure 2. Displacements of tissue during the respiratory cycle in subject 1
A, average anteroposterior motion of point A and point B tracked on the genioglossus and the geniohyoid, respectively, starting from expiration (end inspiration). At the left are anatomical images from the subject on which the positions of points A–D are marked. The posterior and anterior motions of the points are represented by negative and positive displacements, respectively. B, average motion of 2 points tracked above (point C) and adjacent (point D) to the airway in the upper axial plane. For point C, the posterior and anterior motions are represented by negative and positive displacements, respectively. For point D, motion towards the left and right is represented by negative and positive displacements, respectively. Motions of the points are analysed 3 times for each segment of the respiratory cycle and the results are shown by the lines in grey. The mean results are shown by the black lines. The gaps between each respiratory segment are included to indicate that data for different segments are collected from different breaths. The respiratory cycle begins at the end of inspiration.
Figure 3
Figure 3. Displacement of tissue during the respiratory cycle for the remaining subjects
Data shown is for the analysis in Fig. 2A. The average motion of point A on the genioglossus starting from end-inspiration for the 5 additional subjects. The respiratory cycle was divided into 6 segments in subject 6, 5 segments in subjects 2 and 5, and 4 segments in subjects 3 and 4. The posterior and anterior motions of the point are represented by negative and positive displacements, respectively. Vertical arrows depict the approximate onset of anterior motion in each subject. The bottom right panel shows mean data superimposed from each subject. The traces are aligned with the onset of apparent anterior motion of genioglossus (vertical arrow) and the gaps between recording segments have been removed. For this panel, data are shown for all subjects and the calibrations are ∼1 mm and ∼40% of the respiratory cycle.
Figure 4
Figure 4. Movement of a grid of points on the tongue at four times in the respiratory cycle in one subject
While Fig. 3 and part of Fig. 2A show the displacement of a single point tracked on the genioglossus, this analysis shows a grid of points tracked on the tongue. Panels A and B each show a triangular mesh superimposed on the tagged image in the mid-sagittal plane and lower axial plane, respectively. The vertical and horizontal distance between grid points is 5 mm (panel A) and 8 mm (panel B). In each panel, the region of the tongue with distinct respiratory movements is enlarged. In both panels, there is movement of the posterior region of genioglossus.
Figure 6
Figure 6. Direction-dependent strain fields of the tongue in the axial plane during respiration
This is similar to the analysis in Fig. 5. It shows the deformed grids and the strain maps at different times during the respiratory cycle, superimposed on the tongue in the lower axial plane. The mandible and airway are shown with a white line. The three time points were selected based on data acquired from specific respiratory segments (see Methods).The strain maps are placed directly on top of the airway. The middle row of images represents tissue strain in the lateral direction and the lower row represents tissue strain in the anteroposterior direction. Tissue has zero strain at end-inspiration. Movement of the tongue was slightly asymmetric, giving rise to asymmetric strain patterns.
Figure 5
Figure 5. Direction-dependent strain fields of the tongue in the midsagittal plane during respiration
This shows deformed grids and strain maps at different times during the respiratory cycle, superimposed on the tongue in the mid-sagittal plane. The three time points were selected based on data acquired from specific respiratory segments in one subject (see Methods). Strain values are represented by the colour bar shown on the right. Tissue was taken to have zero strain at end-inspiration. Red represents positive strain (tissue elongation) of 20% and blue represents negative strain (tissue shortening) of −20%. The middle row of images shows tissue strains in the anteroposterior direction and the lower row of images represents tissue strain in the rostrocaudal direction. Narrower grid spacing in either the anteroposterior or rostrocaudal direction translates into compressive strain in that direction. Note that during mid-inspiration, there is focal shortening of muscle fibres at the posterior region of the genioglossus in the anteroposterior direction (see arrow). This is accompanied by elongation in the same region in the rostrocaudal direction and surrounding regions of tissue shortening above and below (see lower right panel).

Comment in

References

    1. Amis TC, O'Neill N, Wheatley JR. Oral airway flow dynamics in healthy humans. J Physiol. 1999;515:293–298. - PMC - PubMed
    1. Armstrong JJ, Leigh MS, Sampson DD, Walsh JH, Hillman DR, Eastwood PR. Quantitative upper airway imaging with anatomic optical coherence tomography. Am J Respir Crit Care Med. 2006;173:226–233. - PubMed
    1. Bailey EF, Huang YH, Fregosi RF. Anatomic consequences of intrinsic tongue muscle activation. J Appl Physiol. 2006;101:1377–1385. - PubMed
    1. Berry RB, White DP, Roper J, Pillar G, Fogel RB, Stanchina M, Malhotra A. Awake negative pressure reflex response of the genioglossus in OSA patients and normal subjects. J Appl Physiol. 2003;94:1875–1882. - PubMed
    1. Brennick MJ, Gefter WB, Margulies SS. Mechanical effects of genioglossus muscle stimulation on the pharyngeal airway by MRI in cats. Respir Physiol Neurobiol. 2007;156:154–164. - PubMed

Publication types

LinkOut - more resources