

Dynamics of immune escape during HIV/SIV infection
- PMID: 18636096
- PMCID: PMC2423483
- DOI: 10.1371/journal.pcbi.1000103
Dynamics of immune escape during HIV/SIV infection
Abstract
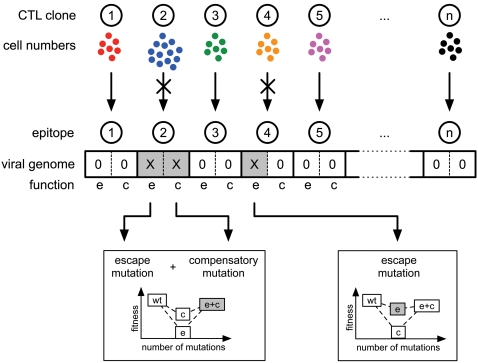
Several studies have shown that cytotoxic T lymphocytes (CTLs) play an important role in controlling HIV/SIV infection. Notably, the observation of escape mutants suggests a selective pressure induced by the CTL response. However, it remains difficult to assess the definite role of the cellular immune response. We devise a computational model of HIV/SIV infection having a broad cellular immune response targeting different viral epitopes. The CTL clones are stimulated by viral antigen and interact with the virus population through cytotoxic killing of infected cells. Consequently, the virus population reacts through the acquisition of CTL escape mutations. Our model provides realistic virus dynamics and describes several experimental observations. We postulate that inter-clonal competition and immunodominance may be critical factors determining the sequential emergence of escapes. We show that even though the total killing induced by the CTL response can be high, escape rates against a single CTL clone are often slow and difficult to estimate from infrequent sequence measurements. Finally, our simulations show that a higher degree of immunodominance leads to more frequent escape with a reduced control of viral replication but a substantially impaired replicative capacity of the virus. This result suggests two strategies for vaccine design: Vaccines inducing a broad CTL response should decrease the viral load, whereas vaccines stimulating a narrow but dominant CTL response are likely to induce escape but may dramatically reduce the replicative capacity of the virus.
Conflict of interest statement
The authors have declared that no competing interests exist.
Figures
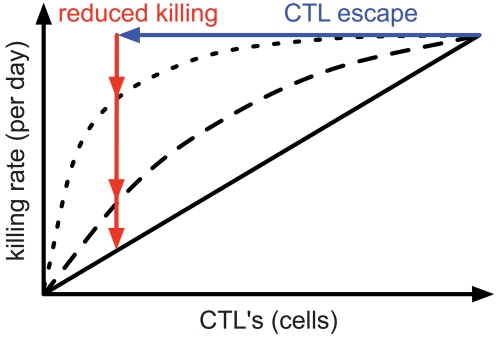
 . For all figures, hk = 1012, i.e. killing follows mass-action dynamics.
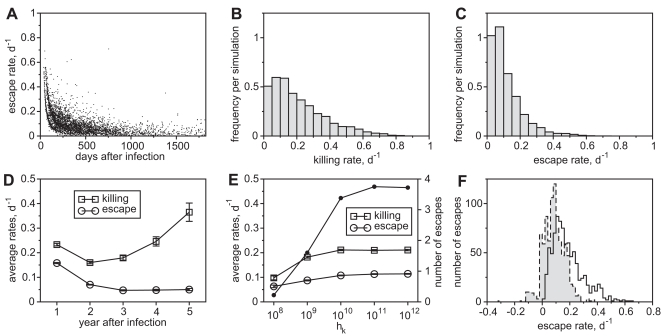
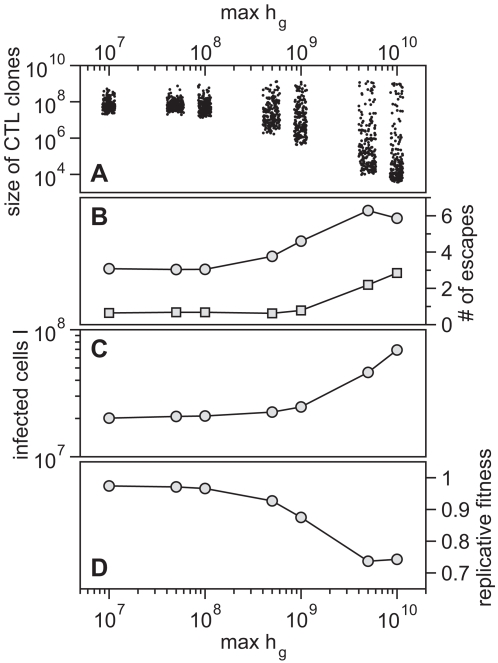
 . Lower values of
  yield a broad repertoire of CTL clones that are similar in size whereas for higher
  the degree of immunodominance increases. The dots represent the size of CTL clones for 10 simulations at 50 days after infection. Noise is added on the horizontal axis for better visibility. (B) Escape is more frequent for a higher degree of immunodominance. The numbers of escape variants that have occurred within 5 years of infection are shown as circles. As many escapes start to oscillate or revert back to wild-type, the number of escapes that are above 50% in frequency at 5 years after infection is shown as squares. (C) Infected cell numbers increase with increasing immunodominance. (D) The replicative fitness of the virus decreases with increasing immunodominance. Numbers are given after 5 years of infection and represent averages from 1000 simulation runs.
References
-
- Kaslow R, Carrington M, Apple R, Park L, Munoz A, et al. Influence of combinations of human major histocompatibility complex genes on the course of HIV-1 infection. Nat Med. 1996;2:405–11. - PubMed
-
- Schmitz J, Kuroda M, Santra S, Sasseville V, Simon M, et al. Control of viremia in simian immunodeficiency virus infection by CD8+ lymphocytes. Science. 1999;283:857–60. - PubMed
-
- Friedrich T, Dodds E, Yant L, Vojnov L, Rudersdorf R, et al. Reversion of CTL escape-variant immunodeficiency viruses in vivo. Nat Med. 2004;10:275–81. - PubMed
-
- Barouch D, Powers J, Truitt D, Kishko M, Arthur J, et al. Dynamic immune responses maintain cytotoxic T lymphocyte epitope mutations in transmitted simian immunodeficiency virus variants. Nat Immunol. 2005;6:247–52. - PubMed
-
- Kent S, Fernandez C, Dale C, Davenport M. Reversion of immune escape HIV variants upon transmission: insights into effective viral immunity. Trends Microbiol. 2005;13:243–6. - PubMed
Publication types
MeSH terms
Substances
LinkOut - more resources
Full Text Sources
Other Literature Sources
Medical
