. 2008 Jul 18;4(7):e1000123.
doi: 10.1371/journal.pcbi.1000123.

Emergent synchronous bursting of oxytocin neuronal network

Affiliations

Emergent synchronous bursting of oxytocin neuronal network

Enrico Rossoni et al. PLoS Comput Biol. .

Abstract

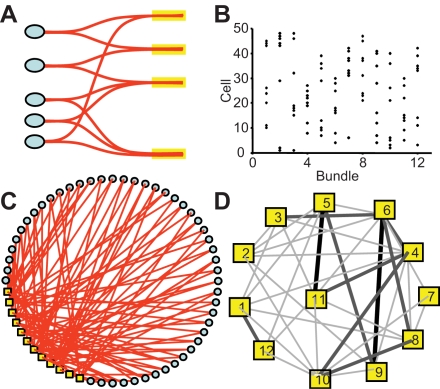
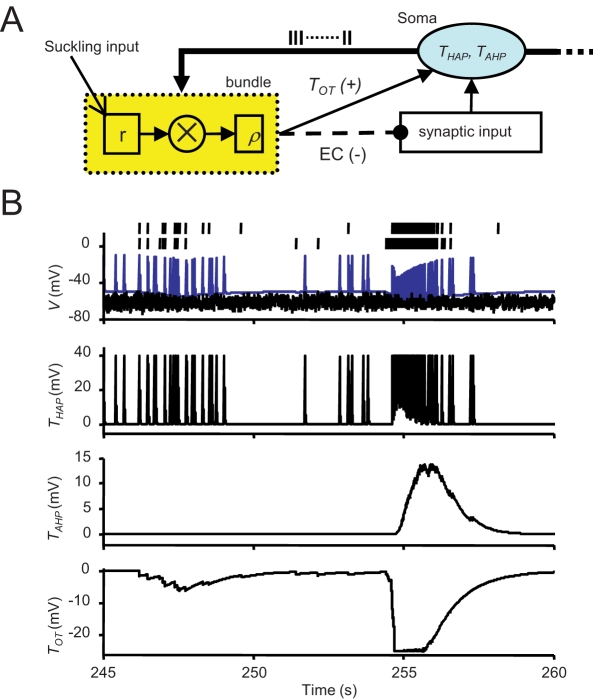
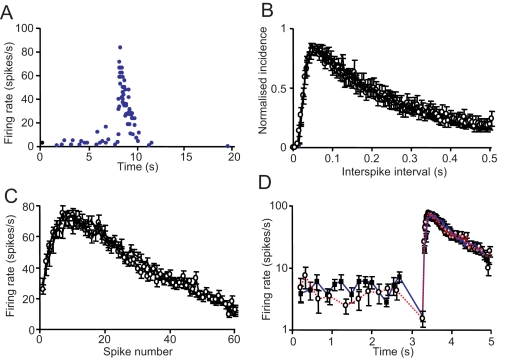
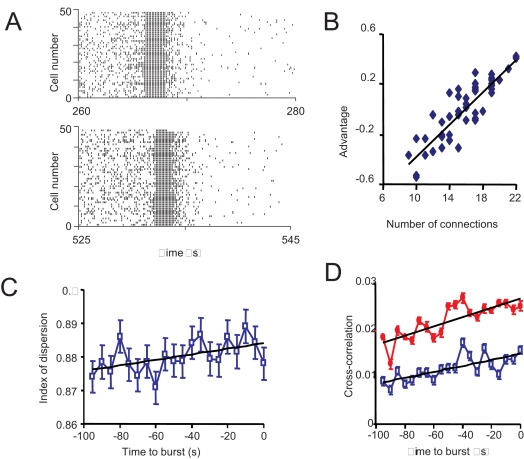
When young suckle, they are rewarded intermittently with a let-down of milk that results from reflex secretion of the hormone oxytocin; without oxytocin, newly born young will die unless they are fostered. Oxytocin is made by magnocellular hypothalamic neurons, and is secreted from their nerve endings in the pituitary in response to action potentials (spikes) that are generated in the cell bodies and which are propagated down their axons to the nerve endings. Normally, oxytocin cells discharge asynchronously at 1-3 spikes/s, but during suckling, every 5 min or so, each discharges a brief, intense burst of spikes that release a pulse of oxytocin into the circulation. This reflex was the first, and is perhaps the best, example of a physiological role for peptide-mediated communication within the brain: it is coordinated by the release of oxytocin from the dendrites of oxytocin cells; it can be facilitated by injection of tiny amounts of oxytocin into the hypothalamus, and it can be blocked by injection of tiny amounts of oxytocin antagonist. Here we show how synchronized bursting can arise in a neuronal network model that incorporates basic observations of the physiology of oxytocin cells. In our model, bursting is an emergent behaviour of a complex system, involving both positive and negative feedbacks, between many sparsely connected cells. The oxytocin cells are regulated by independent afferent inputs, but they interact by local release of oxytocin and endocannabinoids. Oxytocin released from the dendrites of these cells has a positive-feedback effect, while endocannabinoids have an inhibitory effect by suppressing the afferent input to the cells.


Conflict of interest statement

The authors have declared that no competing interests exist.

Figures

Figure 1
Figure 1. Structure of the Model Network.
(A)Schematic diagram of the organization of the oxytocin network; the yellow boxes represent dendritic bundles. (B) The (bipartite) adjacency matrix for a randomly generated network with 48 neurons and 12 bundles; the squares mark non-zero matrix elements. (C) Visualization of the network with blue circles for neurons and yellow squares for bundles. (D) The heterogeneity of connectivity in a randomly wired model of 12 bundles. The width of an edge between any two bundles represents the number of neurons having dendrites in both bundles. In this example, most bundles are ‘bridged’ by at most one neuron; a few others share two or three neurons. By means of such neurons, any increase of the spike activity of the neurons projecting to one bundle can affect the neurons in all the connected bundles, hence rapidly propagates through the network.
Figure 2
Figure 2. The Structure of a Single Model Neuron.
(A) Schematic illustrating the organization of a single model neuron: it receives random excitatory and inhibitory synaptic inputs, and its excitability is modelled as a dynamically changing spike threshold that is influenced by a post-spike HAP (parameter THAP), and a slower AHP (TAHP). Each neuron interacts with neighbouring oxytocin neurons by two dendrites that project to bundles (yellow), and its excitability is increased when oxytocin is released in the vicinity of these dendrites (TOT). Activity-dependent production of endocannabinoids (EC) feeds back to reduce synaptic input rates. (B) This analyses the behavior of one model cell during a burst in detail. The upper two raster traces show the times of occurrence of all oxytocin release events in the two dendritic bundles to which the cell is connected. Below this is the soma activity: the black line (V) shows the impact of excitatory and inhibitory inputs, and the blue line shows the dynamic spike threshold, showing the effects of post-spike activity changes and the effects of oxytocin. The bottom three traces show THAP , TAHP, and TOT.
Figure 3
Figure 3. Comparison of Bursting Activity in Real and Modelled Oxytocin Cells.
(A) A typical burst in a model cell plotted as instantaneous firing rate (each point is the reciprocal of the interval since the previous spike). This profile is essentially indistinguishable to burst profiles observed in vivo. (B) Consensus interspike interval distribution (see [34]) of 23 oxytocin cells recorded from the supraoptic nucleus in vivo (circles) compared with that generated by the model (squares). In both cases, histograms were constructed from spike activity between the bursts. The individual distributions were normalized to the height of the mode and averaged; bars are S.E.M. (C) Mean profiles of milk-ejection bursts from a real oxytocin cell (circles) and from a model cell (squares). Each profile is constructed from 17 bursts, and shows the mean+S.E. instantaneous firing rate plotted for each interspike interval within the bursts. (D) Mean instantaneous firing rates vs. time of occurrence on a semi-log plot from a real oxytocin cell (circles, red dashed line) and from a model cell (squares, blue line). The semi-log plot displays more clearly the effect on instantaneous frequency just before a burst, and it shows that, in both real cells and model cells, most bursts begin with a slight decrease in instantaneous firing rate. In the model this is because most cells are usually follower cells - a burst has begun elsewhere, and the first indication of this is a decrease in synaptic input as a result of the inhibitory effects of cannabinoids. The bursts begin only when the excitatory effect of oxytocin exceeds this.
Figure 4
Figure 4. Random Onset of Bursts.
(A) Raster plots showing the spikes generated by all the cells of the model in two bursts. (B) We considered a network with the same number of cells and bundles (and the same mean connectivity, ) but where the number of dendrites varied in each bundle. For each cell, the leader/follower character was measured by its mean ‘advantage’. The mean ‘advantage’ (start time relative to other cells, averaged over 120 bursts), plotted for each cell against the number of dendro-dendritic connections, shows that bursts are more likely to start in regions of the network where dendritic bundling is more pronounced. (C) The index of dispersion of the firing rate before bursts (in spikes/0.5 s, averaged over 5-s intervals; each point is an average over all cells and 136 bursts). The increase shows that firing is increasingly irregular just before a burst. The index of dispersion is the ratio of the SD of the firing rate to the mean firing rate over the same period. In the absence of retrograde attenuation by endocannabinoids (i.e. when α is set to 0), there is no increase in the index of dispersion, so the increased variability reflects the increasing antagonism between the excitatory effects of oxytocin and the inhibitory effects of endocannabinoids. (D) The cross-correlation of firing rates before bursts (in spikes/0.5 s; cross-correlations measured over 5 s-intervals, with zero time lag; average over 136 bursts; bars are S.E.M.). The blue squares are means of the cross-correlations between all pairs of cells in the network; the red circles are the mean ‘intra-bundle’ cross-correlations (the mean cross-correlation of all the pairs of cells projecting to the same bundle).
Figure 5
Figure 5. Network Connectivity and Co-ordination of Bursting Raster Plot of Spike Activity During a Burst in a Network of 1000 Neurons with (A) and (B).
(C) The number of neurons recruited into bursting versus time after the first burst seen in the network, for a network of 1000 neurons with different connectivity (blue symbols, red symbols). The y axis is the logarithm of the number of recruited cells, so an exponential (“increasingly rapid”) growth appears as linear. Synchronisation occurs more rapidly when the connectivity is greater. (D) Raster plot of the spike activity during a burst in a network of 3000 neurons with.
Figure 6
Figure 6. “Post-burst” Silences Observed in the Absence of Bursts.
(A) The top trace shows the typical intramammary pressure response indicative of a reflex milk let-down in a lactating rat; the middle trace is a raster plot indicating the corresponding spike discharge of a supraoptic neuron, and the lower trace is the corresponding firing rate record. This cell showed no burst activity preceding milk ejection, but showed a typical “post-burst” silence. (Note that the increase in intramammary pressure normally occurs about 12 s after the milk-ejection burst; this delay reflects the delay in oxytocin released from the pituitary gland reaching the mammary gland, not a delay in oxytocin release). (B) Simultaneous activity of two cells in the model, in one of which the sensitivity to oxytocin has been disabled. While the upper cell shows typical intermittent bursts, the lower cell shows post-burst silences, but no bursts, due to removal of afferent excitation by oxytocin.
Figure 7
Figure 7. Role of Dendritic Release in Generating Bursts.
(A) Upper trace: The evolution of the mean firing rate in the model (in spikes/s; average over all neurons); the vertical axis has been capped to highlight the fluctuations of the basal activity. Bottom trace: the evolution of dendritic stores level, given as the average over all the dendrites in the network; grey bars are SD. (B) The stores level at the time of the bursts (average over all dendrites) plotted against the logarithm of the inter-burst interval. (C) The rate of change of the stores plotted against the average store level. Both quantities are averaged over all dendrites. Mono-exponential behaviour, as expected from a process approaching saturation, would appear as a downward straight line, the slope being proportional to the average release rate from stores. This plot shows a slight departure from a mono-exponential trend at high stores levels, where there is a small decrease in the slope, corresponding to a reduction of the release rate, due to endocannabinoid release.
Figure 8
Figure 8. Paradoxical Behaviour, Observed Experimentally, Reproduced in the Model.
(A) Left trace: A large increase in excitatory input rate will stop ongoing bursting activity in the model network. The bar marked ‘Glutamate’ corresponds to a 150% step increase in the excitatory input rate (from basal levels Hz; Hz). Right: Similarly, excitatory stimuli, such as systemic injection of hypertonic saline block ongoing bursting in oxytocin cells in vivo; from . (B) Left: increasing the inhibitory synaptic input can paradoxically start bursting activity in the model when the suckling input is sub-threshold (kp = 1.4/s). The bar marked ‘GABA’ corresponds to a 150% step increase in the inhibitory input rate (from a basal level of 80 Hz). Right: The effect of local application of a GABA agonist to an oxytocin cell recorded from the supraoptic nucleus in vivo, from . In the experiments, GABA was applied by local pressure injection; the timing of applications is marked, but the resulting exposure to GABA exceeds this, as evident here by the sustained reduction in background firing rate. Thus the burst occurs during elevated GABA exposure. (C) Firing rate of a model cell showing bursting in response to suckling input (bar). Note that, in this rare example, a single burst occurs after removing the suckling stimulus.
Figure 9
Figure 9. Effect of Suckling on Electrical Activity of Model Cells A and B.
In the model, suckling results in activity-dependent retrograde inhibition of the synaptic inputs. Accordingly, as synaptic input level increases, electrical activity increases faster in the absence of suckling than in its presence. (A) The blue squares show the mean firing rate of model cells with normal network interaction (i.e. with suckling input), as a function of the mean synaptic input rate. The red diamonds show the behaviour in the same conditions but without suckling. The inhibitory input is fixed at 80 Hz. Thus in the model, suckling reduces the background activity of the fastest firing cells. (B) As in (A), but plotting the coefficient of variation (CV) of the interspike intervals (SD (interval)/mean (interval)). This standard measure of the irregularity of firing shows that the model cells fire more regularly as the mean level of synaptic input increases. The effect of suckling is to increase the irregularity of firing of neurons, mainly by reducing the firing rate of the fastest cells. (C) In the model, during suckling, the frequency of milk-ejection bursts is related to the average level of synaptic input in a biphasic manner. At very low and at very high levels of input, bursting will not occur. The frequency of bursts was obtained by simulating the model at varying excitatory input rates and, also shows the effect of altering the frequency threshold for dendritic release: the higher the threshold, the fewer bursts will occur. (D) The frequency of bursting depends on how homogeneous the background firing rate of oxytocin cells is. Here, we looked at the effect of a spatially inhomogeneous input on bursting frequency (mean of five trials of 50 min). Homogeneity is measured as the ratio of the SD of the synaptic input rate over the mean. The bars are SD. (E)The effect of endocannabinoids in the model is to increase the range of synaptic input rates compatible with bursting, and to make the mean rate at which bursts occur relatively independent of synaptic input rate within this range. Here, this is illustrated by looking at the consequences of removing the effect of endocannabinoids (no EC, by = 0). This is true for all the threshold values considered, the α setting panel shows the comparison for the control case (fth = 20 Hz).

References

    1. Takayanagi Y, Yoshida, Bielsky IF, Ross HE, Kawamata M, et al. Pervasive social deficits, but normal parturition, in oxytocin receptor-deficient mice. Proc Natl Acad Sci USA. 2005;102:16096–16101. - PMC - PubMed
    1. Nordmann JJ. Ultrastructural morphometry of the rat neurohypophysis. J Anat. 1977;123:213–218. - PMC - PubMed
    1. Leng G, Brown CH, Russell JA. Physiological pathways regulating the activity of magnocellular neurosecretory cells. Prog Neurobiol. 1999;57:625–655. - PubMed
    1. Hatton GI. Astroglial modulation of neurotransmitter/peptide release from the neurohypophysis: present status. J Chem Neuroanat. 1999;16:203–21. - PubMed
    1. Belin V, Moos FC. Paired recordings from supraoptic and paraventricular oxytocin cells in suckled rats: recruitment and synchronization. J Physiol. 1986;377:369–390. - PMC - PubMed

Publication types