. 2008 Aug 12;47(32):8424-33.
doi: 10.1021/bi800359h. Epub 2008 Jul 18.

Interacting targets of the farnesyl of transducin gamma-subunit

Affiliations

Interacting targets of the farnesyl of transducin gamma-subunit

Maiko Katadae et al. Biochemistry. .

Abstract

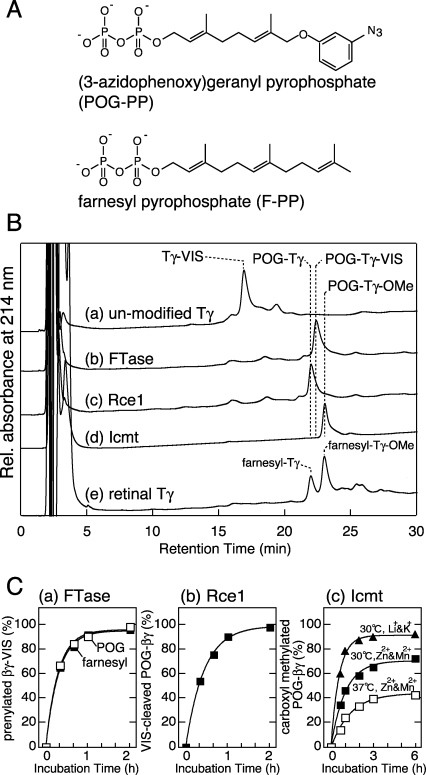
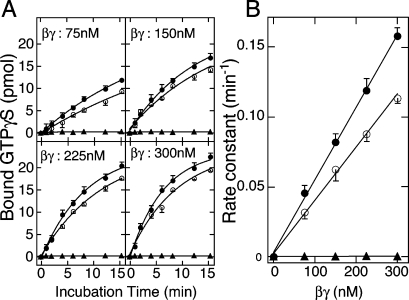
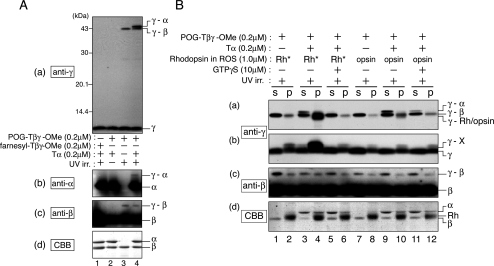
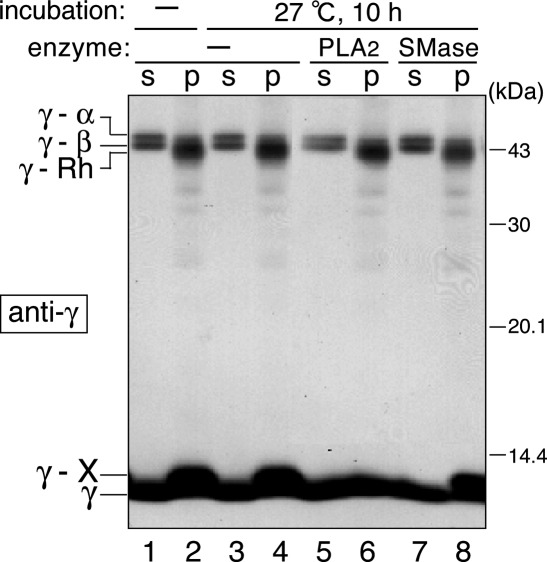
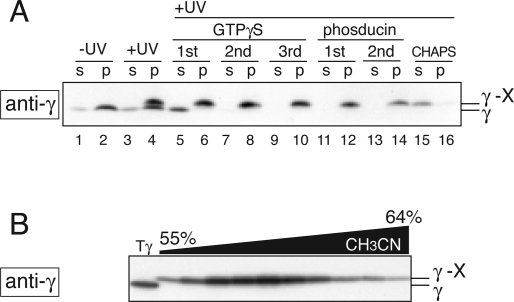
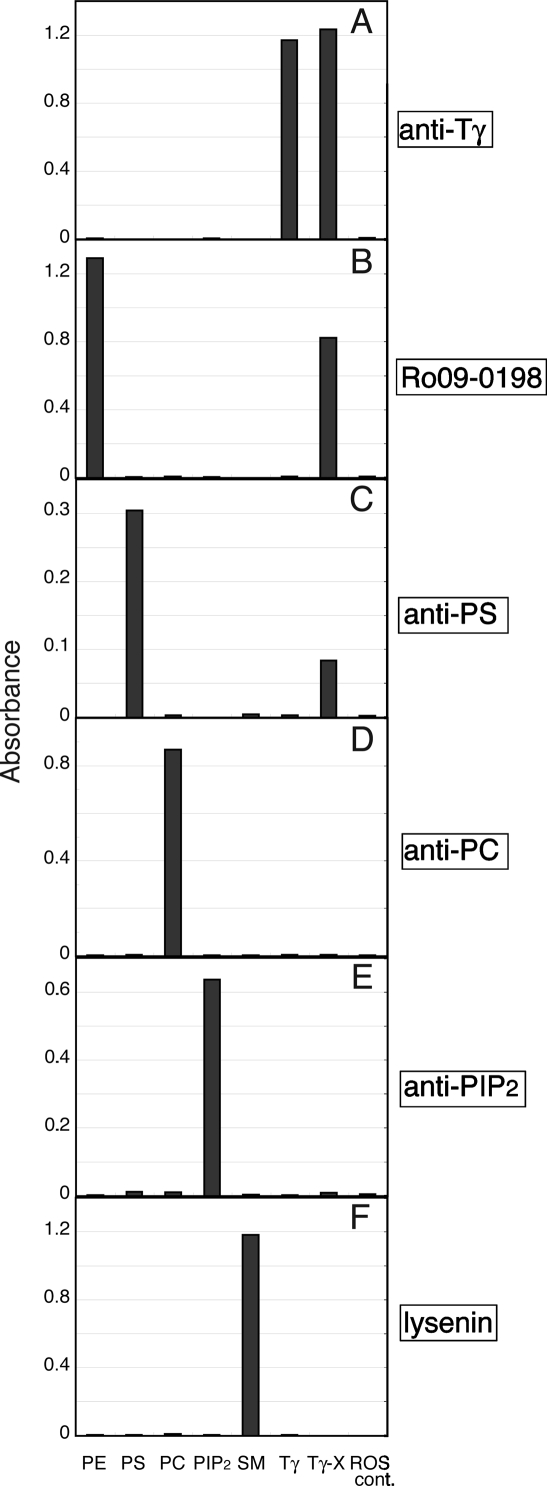
G protein gamma-subunits are isoprenylated and carboxyl methylated at the C-terminal cysteine residue, and the set of the posttranslational modifications is indispensable for the function of the photoreceptor G protein transducin (Talpha/Tbetagamma). To explore farnesyl-mediated molecular interactions, we investigated molecular targets of a Tbetagamma analogue that was engineered to have a photoreactive farnesyl analogue, (3-azidophenoxy)geranyl (POG), covalently bound to the C-terminal cysteine of Tgamma. POG-modified Tbetagamma was further subjected to modification by methylation at the C-terminal carboxyl group, which copies a complete set of the known posttranscriptional modifications of Tbetagamma. Photoaffinity labeling experiment with the photoreactive Tbetagamma analogue in its free form indicated that the POG moiety of Tgamma interacted with Tbeta. In the trimeric Talpha/Tbetagamma complex, the POG moiety was cross-linked with Talpha in addition to concurrent affinity labeling of Tbeta. When photoreactive Tbetagamma was reconstituted with Talpha and light-activated rhodopsin (Rh*) in rod outer segment (ROS) membranes, the POG moiety interacted with not only Talpha and Tbeta but also Rh* and membrane phospholipids. The cross-linked phospholipid species was analyzed by ELISA employing a variety of lipid-binding probes, which revealed phosphatidylethanolamine (PE) and phosphatidylserine (PS) as selective phospholipids for POG interaction in the ROS membranes. These results demonstrate that the modifying group of Tgamma plays an active role in protein-protein and protein-membrane interactions and suggest that the farnesyl-PE/PS interaction may support the efficient formation of the signaling ternary complex between transducin and Rh*.


Figures

Figure 1
Figure 1
(A) Structures of POG-PP [(3-azidophenoxy)geranyl pyrophosphate] and farnesyl pyrophosphate. (B) HPLC analysis of Tγ in each modification step. Unmodified Tβγ-VIS was incubated with yeast FTase in the presence of POG-PP, and aliquots of the reaction mixtures were subjected to reverse-phase HPLC analysis before (trace a) and after (trace b) the POG-transfer reaction. The analysis was also performed following Rce1 treatment (trace c) and Icmt treatment in the presence of AdoMet (trace d). Retinal Tγ was analyzed as a standard (trace e). HPLC analysis was performed as described in Experimental Procedures. Each peak fraction detected by the absorbance at 214 nm was collected and analyzed by MALDI-TOF mass spectrometry with the Voyager-DE (Applied Biosystems) spectrometer. The singly and doubly protonated ion signals of cytochrome c (from horse heart, Mr = 12359.7) were used as an internal standard of mass calibration. The observed [M + H]+ values of the peak fractions were 8411.0 (trace a), 8681.1 (trace b), 8381.6 (trace c), and 8395.4 (trace d), in good agreement with the calculated [M + H]+ values of Tγ-VIS (8411.4), POG-Tγ-VIS (8680.8), POG-Tγ (8381.4), and POG-Tγ-OMe (8395.4), respectively. Due to adsorption, Tβ was not eluted from the column. (C) Time courses of prenyl transfer (panel a), VIS cleavage (panel b), and carboxyl methylation (panel c) reactions catalyzed by FTase, Rce1, and Icmt, respectively.
Figure 2
Figure 2
Rh*-catalyzed GTPγS binding to Tα stimulated by POG-Tβγ-OMe. (A) Time courses of GTPγS binding to Tα in the presence of various concentrations of POG-Tβγ-OMe (open circles), farnesyl-Tβγ-OMe (closed circles), and unmodified Tβγ-CVIS (closed triangles). Each reaction was carried out in a set of duplicate mixtures (each 100 μL) composed of various concentrations of POG-Tβγ-OMe or farnesyl-Tβγ-OMe (75, 150, 225, and 300 nM), 0.8 μM retinal Tα, 30 nM Rh* in ROS membranes, 0.002% Lubrol PX, 2.5 mg/mL ovalbumin, and 10 μM [35S]GTPγS (74 MBq/mmol) in 10 mM MOPS−NaOH buffer (pH 7.5) containing 1 mM MgCl2. The reaction was initiated by the addition of [35S]GTPγS, and at the indicated times of incubation at 0 °C, 10 μL aliquots were transferred to MultiScreen filter cups (Millipore; 0.45 μm cellulose membrane) filled with 180 μL of 100 mM Tris-HCl (pH 7.5, at 0 °C) containing 1 mM MgCl2 and 2 mM GTP to quench GTPγS binding. Filters were washed four times and the radioactivity was determined by a liquid scintillation method as described. The data were fitted to the equation B(t) = Bmax (1 − exp(−kt)), where B(t) is the amount of bound GTPγS at time = t (min) and Bmax (in pmol) is the maximum binding at infinite time. Each data point is the average ± variation of duplicate determinations from a single experiment, and a representative set of data from experiments repeated three times is shown. (B) The rate constants (k) calculated from (A) were plotted against the concentrations of POG-Tβγ-OMe (open circles), farnesyl-Tβγ-OMe (closed circles), and unmodified Tβγ-VIS (closed triangles). Each data point is the average ± SD of three independent measurements of the time constant as exemplified in (A).
Figure 3
Figure 3
Photoaffinity labeling experiments in solution (A) and in ROS membranes (B). (A) Each sample (100 μL) contained the indicated combinations of 0.2 μM POG-Tβγ-OMe or retinal Tβγ (farnesyl-Tβγ-OMe) and 0.2 μM Tα (at final concentration). After UV irradiation, the samples were subjected to SDS−polyacrylamide gel (12.5%) electrophoresis. Proteins were transferred to a PVDF membrane for immunostaining by anti-Tγ (panel a), anti-Tα (panel b), or anti-Gβ (panel c) antibodies or CBB-stained (panel d). (B) Each sample (100 μL) contained the indicated combinations of 0.2 μM POG-Tβγ-OMe, 0.2 μM Tα, 1.0 μM Rh* or opsin in ROS membranes, and 10 μM GTPγS (at final concentration). After UV irradiation, the samples were centrifuged to obtain the supernatant (s) and the membrane pellet (p), which were subjected to SDS−polyacrylamide gel (12.5%) electrophoresis. Proteins were transferred to a PVDF membrane for immunostaining by anti-Tγ and anti-Gβ antibodies. Shown are the clipped images of the anti-Tγ blot at the 30−50 kDa region (panel a) or at the gel front region (panel b), anti-Gβ blot at 30−50 kDa (panel c), and the CBB-stained gel at the 30−50 kDa region (panel d). Shown is a representative set of data from experiments repeated five times with similar results.
Figure 4
Figure 4
Characterization of Tγ−X product. Samples (100 μL, final volume) containing 0.2 μM POG-Tβγ-OMe, 0.2 μM Tα, and 1.0 μM Rh* in ROS membranes (at final concentration) were incubated at 4 °C for 30 min and were UV irradiated as described above. After UV irradiation, the samples were centrifuged at 20000g at 4 °C for 20 min in order to separate the supernatant from the membrane fraction. These fractions were supplemented with 0.005% (v/v) Triton X-100 and incubated at 27 °C for 10 h in the absence or presence of 10 units of either bee venom phospholipase A2 (PLA2, lanes 5 and 6) or Bacillus sphingomyelinase (SMase, lanes 7 and 8). Samples were subjected to SDS−PAGE for immunoblot analysis by using anti-Tγ antibody. Shown is a representative set of data from experiments repeated three times with similar results.
Figure 5
Figure 5
Isolation of Tγ−X product from ROS membranes. (A) Immunoblot patterns of the extracted Tγ−X species. The GTPγS-wash and phosducin-extraction procedures were repeated three and two times, respectively. These aliquots of supernatants (s) and pellets (p) were electrophoresed and transferred to a PVDF membrane for immunostaining. Shown is the clipped image of the anti-Tγ blot at the gel front region. (B) Immunoblot patterns of the fractions eluted from the reverse-phase HPLC as described in Experimental Procedures. Each fraction was subjected to SDS−polyacrylamide gel (12.5%) electrophoresis and immunostaining by anti-Tγ antibody. The fractions containing the Tγ−X product (fractions 25−34) are shown.
Figure 6
Figure 6
Characterization of Tγ−X product by ELISA analysis. Binding of Tγ−X, Tγ, ROS control, and five types of lipids (PE, PS, PC, PIP2, and SM) was determined by ELISA analysis as described in Experimental Procedures. Sample wells were incubated with (A) anti-Tγ antibody, (B) anti-PE, (C) anti-PS, (D) anti-PC, (E) anti-PIP2, and (F) anti-SM probes. Abbrevaitions: PE, phosphatidylethanolamine; PS, phosphatidylserine; PC, phosphatidylcholine; PIP2, phosphatidylinositol 4,5-bisphosphate; SM, sphingomyelin; Tγ−X, the combined pool of fractions in Figure 5B; Tγ, purified farnesyl-Tγ-OMe; ROS-cont., the fraction prepared from the UV-irradiated ROS membrane as described in Experimental Procedures. Shown is a representative set of data from experiments repeated three times with similar results.

Similar articles

Cited by

References

    1. Arshavsky V. Y.; Lamb T. D.; Pugh E. N. Jr. (2002) G proteins and phototransduction. Annu. Rev. Physiol. 64, 153–187. - PubMed
    1. Fukada Y.; Takao T.; Ohguro H.; Yoshizawa T.; Akino T.; Shimonishi Y. (1990) Farnesylated γ-subunit of photoreceptor G protein indispensable for GTP-binding. Nature 346, 658–660. - PubMed
    1. Lai R. K.; Perez-Sala D.; Canada F. J.; Rando R. R. (1990) The γ subunit of transducin is farnesylated. Proc. Natl. Acad. Sci. U.S.A. 87, 7673–7677. - PMC - PubMed
    1. Matsuda T.; Fukada Y. (2000) Functional analysis of farnesylation and methylation of transducin. Methods Enzymol. 316, 465–481. - PubMed
    1. Casey P. J.; Seabra M. C. (1996) Protein prenyltransferases. J. Biol. Chem. 271, 5289–5292. - PubMed

Publication types