Controlled Clinical Trial
. 2008 Aug;103(8):1898-905.
doi: 10.1111/j.1572-0241.2008.01913.x. Epub 2008 Jul 12.

Utilizing intraluminal pressure gradients to predict esophageal clearance: a validation study

Affiliations
Controlled Clinical Trial

Utilizing intraluminal pressure gradients to predict esophageal clearance: a validation study

John E Pandolfino et al. Am J Gastroenterol. 2008 Aug.

Abstract

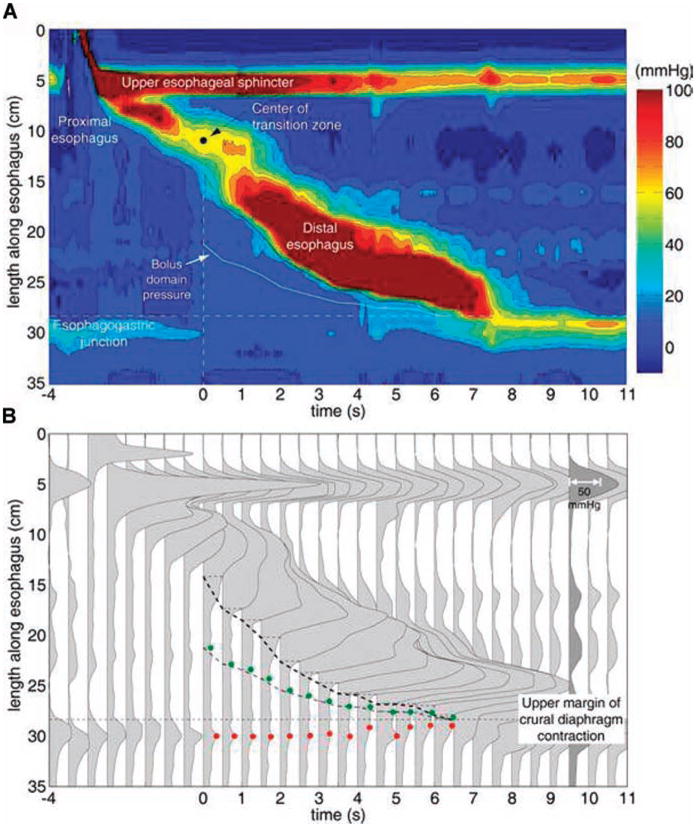
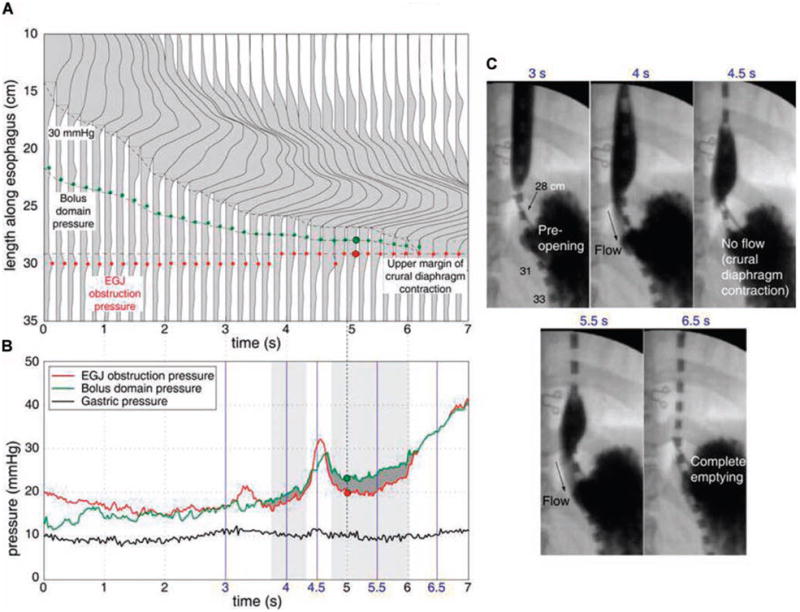
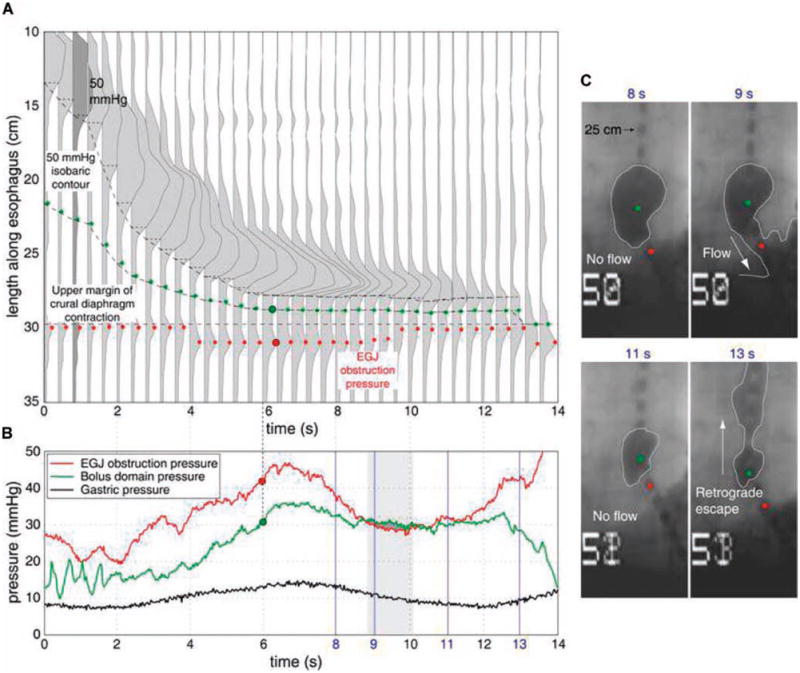
Background: Esophageal bolus clearance requires a preferential esophagogastric pressure gradient sustained for a sufficient period. We aimed to validate a high-resolution manometry (HRM) paradigm for predicting bolus clearance.

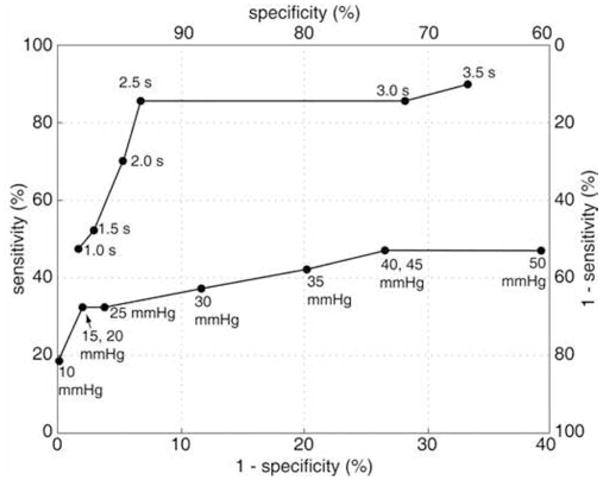
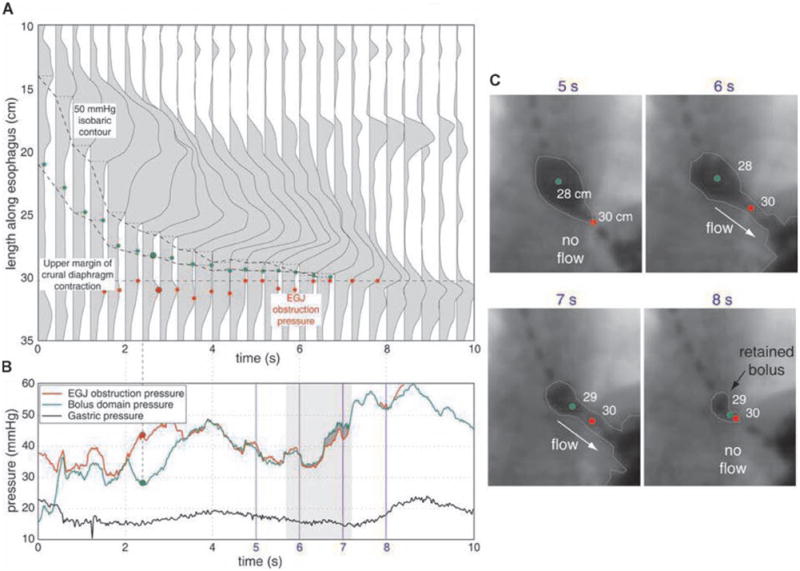
Methods: Twenty volunteers and 30 patients were studied with HRM during barium swallows with concurrent fluoroscopy. Simultaneous bolus domain pressure and esophagogastric junction (EGJ) obstruction pressure were plotted and flow permissive time was tallied during which the bolus domain pressure exceeded the EGJ obstruction pressure. Distal peristaltic integrity was assessed at incrementally increasing pressure isobaric contour thresholds from 15-40 mmHg. ROC analysis was performed to assess the sensitivity and specificity of cutoff values for flow permissive time and peristaltic amplitude for predicting incomplete clearance as verified fluoroscopically.

Results: Flow permissive time < or =2.5 s had a sensitivity of 86% and specificity of 92% for predicting incomplete clearance. In contrast, a 30-mmHg peristaltic amplitude had a sensitivity of only 48% and specificity of 88%. Incomplete clearance was variably attributable to functional EGJ obstruction, hiatus hernia, or impaired peristalsis.

Conclusions: A detailed analysis of intraluminal pressure gradients in the distal esophagus and across the EGJ in the postdeglutitive period predicts esophageal bolus clearance with far greater accuracy than any threshold value of peristaltic amplitude.


Conflict of interest statement

CONFLICT OF INTEREST

Guarantor of the article: John Pandolfino, M.D.

Specific author contributions: John Pandolfino: hypothesis, study design, data analysis, primary author; Sudip K. Ghosh: hypothesis, study design, computer programming, analysis; Nilesh Lodhia: data analysis; Peter J. Kahrilas: study design, co-author.

Potential competing interests: None.

Figures

Figure 1
Figure 1
Pressure topography (A) and spatial pressure variation (B) representations of a normal swallow. The proximal esophagus, the distal esophagus, and the transition zone that separates them are clearly shown in the pressure topography plot. Time 0 corresponds to center of the manometrically defined transition zone. The heavy black isobaric contour line represents the 30-mmHg threshold and the trajectory of the bolus domain pressure is illustrated midway between the 30-mmHg isobaric contour and the proximal margin of the EGJ. Panel B illustrates a series of spatial pressure variation plots at 0.5-s intervals of the same swallow. The darkened plot (9.5 s) shows the pressure scaling. This method provides a convenient means to visualize intraluminal pressure gradients responsible for bolus transit. The trajectory of the 30-mmHg isobaric contour (dashed line), the maximal EGJ obstruction pressure (red circle), and the bolus domain pressure (green circle) are also shown.
Figure 2
Figure 2
Bolus driving pressure (BDP) analysis for a normal swallow. Panel A illustrates a detailed spatial pressure variation plot of distal esophageal peristalsis of the swallow shown in Figure 1 with increased time resolution to 0.2 s. Panel B shows the BDP analysis in which the instantaneous bolus domain pressure, EGJ obstruction pressure, and gastric pressure are plotted together. Periods during which the bolus domain pressure exceeds EGJ obstruction pressure are deemed flow permissive and highlighted by the dark gray fill. Fluoroscopically determined periods of flow are shown by the gray rectangular boxes. Panel C illustrates X-ray images of esophageal bolus emptying obtained from concurrent fluoroscopy at the times indicated in blue font. Note the hiatal closure at 4.5 s resulting from a crural diaphragm contraction.
Figure 3
Figure 3
Receiver operating characteristic curves of BDP analysis predicted incomplete clearance and peristaltic amplitude predicted incomplete clearance versus fluoroscopically confirmed incomplete clearance. The optimal BDP threshold value is 2.5 s with both sensitivity and specificity in the range of 90%. Peristaltic amplitude was a far less perfect predictor of impaired clearance with maximal sensitivity of less than 50% and an optimal threshold less well defined, residing in the 15–30 mmHg range.
Figure 4
Figure 4
BDP analysis for a hiatal hernia patient with impaired emptying illustrated as in Figure 2. A 50-mmHg isobaric contour was chosen as the point of inflexion since the bolus domain pressure exceeded 30 mmHg in the hernia sac. The trajectory of the 50 mmHg isobaric contour, the bolus domain pressure measurement location (green dots), and the location of maximum EGJ obstruction pressure (red dots) are shown. Panel B shows the BDP analysis. The period during which the intrabolus pressure exceeds maximum EGJ obstruction pressure was deemed flow permissive and indicated by the heavily grayed area. The period of fluoroscopically determined flow is shown by the gray rectangular box. Panel C shows the corresponding X-ray images obtained at the times indicated in blue font. Note that the hiatal closure at 11 s is followed by a retrograde escape of the bolus at 13 s with corresponding depressurization of the hernia sac as seen by the drop in the bolus domain pressure from 12 to 14 s in panel B.
Figure 5
Figure 5
BDP analysis for a postfundoplication patient with dysphagia illustrated as in Figures 2 and 4. Note the relatively high magnitude of the EGJ obstruction pressure compared to the normal swallow shown in Figure 2. Also note the retained bolus in the distal esophagus at the conclusion of esophageal peristalsis in panel C, 8s.

References

    1. Fox M, Hebbard G, Janiak P, et al. High-resolution manometry predicts the success of oesophageal bolus transport and identifies clinically important abnormalities not detected by conventional manometry. Neurogastroenterol Motil. 2004;16:533–42. - PubMed
    1. Ghosh SK, Kahrilas PJ, Lodhia N, et al. Utilizing intraluminal pressure differences to predict esophageal bolus flow dynamics. Am J Physiol Gastrointest Liver Physiol. 2007;293:G1023–8. - PubMed
    1. Pandolfino JE, El-Serag HB, Zhang Q, et al. Obesity: A challenge to esophagogastric junction integrity. Gastroenterology. 2006;130:639–49. - PubMed
    1. Clouse RE, Staiano A. Topography of the esophageal peristaltic pressure wave. Am J Physiol. 1991;261:G677–84. - PubMed
    1. Ghosh SK, Pandolfino JE, Zhang Q, et al. Quantifying esophageal peristalsis with high-resolution manometry: A study of 75 asymptomatic volunteers. Am J Physiol Gastrointest Liver Physiol. 2006;290:G988–97. - PubMed

Publication types