. 2009 Jan;50(1):44-55.
doi: 10.1111/j.1528-1167.2008.01710.x. Epub 2008 Jul 14.

Role of hippocampal sodium channel Nav1.6 in kindling epileptogenesis

Affiliations

Role of hippocampal sodium channel Nav1.6 in kindling epileptogenesis

Hal Blumenfeld et al. Epilepsia. 2009 Jan.

Abstract

Purpose: Central nervous system plasticity is essential for normal function, but can also reinforce abnormal network behavior, leading to epilepsy and other disorders. The role of altered ion channel expression in abnormal plasticity has not been thoroughly investigated. Nav1.6 is the most abundantly expressed sodium channel in the nervous system. Because of its distribution in the cell body and axon initial segment, Nav1.6 is crucial for action potential generation. The goal of the present study was to investigate the possible role of changes in Nav1.6 expression in abnormal, activity-dependent plasticity of hippocampal circuits.

Methods: We studied kindling, a form of abnormal activity-dependent facilitation. We investigated: (1) sodium channel protein expression by immunocytochemistry and sodium channel messenger RNA (mRNA) by in situ hybridization, (2) sodium current by patch clamp recordings, and (3) rate of kindling by analysis of seizure behavior. The initiation, development, and expression of kindling in wild-type mice were compared to Nav1.6 +/-med(tg) mice, which have reduced expression of Nav1.6.

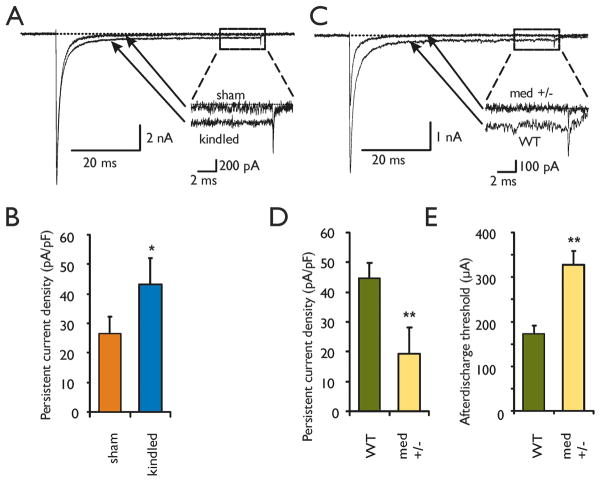
Results: We found that kindling was associated with increased expression of Nav1.6 protein and mRNA, which occurred selectively in hippocampal CA3 neurons. Hippocampal CA3 neurons also showed increased persistent sodium current in kindled animals compared to sham-kindled controls. Conversely, Nav1.6 +/-med(tg) mice resisted the initiation and development of kindling.

Discussion: These findings suggest an important mechanism for enhanced excitability, in which Nav1.6 may participate in a self-reinforcing cycle of activity-dependent facilitation in the hippocampus. This mechanism could contribute to both normal hippocampal function and to epilepsy and other common nervous system disorders.


Figures

Figure 1
Figure 1. Kindling increases Nav1.6 protein expression and mRNA in CA3 pyramidal cells
A. Section through mouse hippocampus showing regions used for analysis of changes in mRNA and protein expression with kindling. Hippocampal neurons are stained by in situ hybridization for Nav1.6. B–C. Examples of Nav1.6-specific immunolabeling showing increased Nav1.6 protein in CA3 of kindled (C) compared to sham-kindled control (B) mice. D–E. Examples of in situ hybridization showing increased Nav1.6 mRNA in CA3 of kindled (E) compared to sham-kindled control (D) mice. F. Quantification of optical density changes in CA3 across all animals for regions shown in B–E. Nav1.6 protein (B,C) and mRNA (D,E) was significantly increased in CA3 region (red bars) of kindled compared to control animals (*, p < 0.05; ANOVA with post-hoc Fisher’s least significant difference analysis, Bonferroni corrected; n=12 kindled animals, 12 sham-kindled controls). CA1 and dentate gyrus (DG) (yellow and blue bars, respectively) showed no significant changes. Images shown in B–E were equivalently enhanced (ie, the identical brightness and contrast enhancements were made to each picture) to help demonstrate the differences in a way that would be clear in a printed format. Actual mean optical density values for examples shown were 22.74 (B), 41.07 (C), 49.61 (D) 85.28 (E). For quantification (F), raw unenhanced images were used. Scale bars in B and D are 50 microns.
Figure 2
Figure 2. Kindling increases persistent sodium current in CA3 neurons
A. Representative voltage clamp current traces from kindled and sham-kindled control CA3 pyramidal neurons. Inset shows magnification of the last 10 ms of the depolarizing pulse (to −20mV from −120mV holding potential), demonstrating increased persistent inward sodium current with kindling. B. Group data showing increased persistent sodium current density in kindled (mean 43.2 ± 8.8 pA/pF SEM; n=30 cells in 5 animals) vs. sham kindled control hippocampal CA3 neurons (26.4 ± 4.4 pA/pF; n = 40 cells in 5 animals; * p < 0.05, two-tailed t-test) at −20mV. C. Representative current traces from Nav1.6 +/− medtg heterozygotes and Nav1.6 +/+ WT littermate CA3 neurons. Inset shows magnification of the last 10 ms of the depolarizing pulse (to −20mV from −120mV holding potential), demonstrating reduced persistent sodium current in Nav1.6 +/− knockout heterozygote. Peak current is also reduced in the Nav1.6 +/− mice. D. Group data showing reduced persistent sodium current density in Nav1.6 +/− heterozygotes (19.4 +− 0.6 pA/pF; n=18 cells in 7 animals) vs. WT hippocampal CA3 neurons (44.8 +− 0.5 pA/pF; n = 19 cells in 4 animals; ** p < 0.01, two-tailed t-test). E. Afterdischarge threshold was increased in Nav1.6 +/− knockout (328 ± 30 μA; n=20 animals) compared to WT control littermates (173 ± 18 μA; n=21 animals; ** p=0.0001, two-tailed t-test).
Figure 3
Figure 3. Nav1.6 +/− mice kindle more slowly than WT littermates
A. Behavioral severity of seizures (mean Racine score) increases more slowly in Nav1.6 +/− mice than in WT controls. Full kindling (3 consecutive class 5 seizures) is achieved after 27 ± 2 (mean ± SEM) stimuli in WT but requires 65 ± 6 stimuli in Nav1.6 +/− mice (p< 0.00001, two-tailed t-test). B. Number of stimuli needed to achieve each stage of kindling for the first time. Nav1.6 mice require more stimuli to reach each stage of kindling compared to WT controls (overall group difference MANOVA, F=26.71, p=0.00002; Individual two-tailed t-tests with Bonferroni correction ** p=0.01, *** p<0.001). The plot in (A) did not include stimuli for which <3 animals remained (seen only towards end of kindling). For A and B, n= 20 Nav1.6 +/− animals, and n=21 WT animals.
Figure 4
Figure 4
Seizure durations were shorter in Nav1.6 +/− mice compared to WT littermates. Mean seizure durations were shorter at stages 1 through 5 of kindling in Nav1.6 +/− mice (** p<0.01, ***p<0.0001, two tailed t-tests with Bonferroni correction). Combining across all Racine stages, overall seizure durations were significantly shorter in Nav1.6 +/− mice (17.5 ± 0.2s; mean ± SEM) compared to WT (21.8 ± 0.5s; P < 0.0001, two-tailed t-test; n=1033 seizures in 20 Nav1.6 +/− heterozygotes; n=507 seizures in 21 WT animals).
Figure 5
Figure 5. When Nav1.6 +/− mice are fully kindled, there is an increase in Nav1.6 protein and mRNA in CA3 neurons, similar to WT (Figure 1)
A–B. Examples of Nav1.6-specific immunolabeling showing increased Nav1.6 protein in CA3 pyramidal cells of kindled Nav1.6 +/− mice (B) compared to sham-kindled Nav1.6 +/− (A) mice. C–D. Examples of in situ hybridization showing increased Nav1.6 mRNA in CA3 neurons of kindled Nav1.6 +/− mice (D) compared to sham-kindled Nav1.6 +/− (C) mice. E. Quantification of optical density changes in CA3 neurons across all animals for regions shown in A–D. Nav1.6 protein (A,B) and mRNA (C,D) was significantly increased in CA3 region (red bars) of kindled compared to sham-kindled animals (*, p < 0.05; ANOVA with post-hoc Fisher’s least significant difference analysis, Bonferroni corrected; n=12 kindled animals, 12 sham-kindled controls). CA1 and dentate gyrus (DG) (yellow and blue bars, respectively) showed no significant changes. Images shown in A–D were equivalently enhanced (ie, the identical brightness and contrast enhancements were made to each picture) to help demonstrate the differences in a way that would be clear in a printed format. Actual mean optical density values for examples shown were 22.31 (A), 39.15 (B), 54.02 (C), 87.69 (D). For quantification (E), raw unenhanced images were used. Scale bars in A and C are 50 microns.

References

    1. Albertson TE, Joy RM, Stark LG. A pharmacological study in the kindling model of epilepsy. Neuropharmacology. 1984;23:1117–1123. - PubMed
    1. Astman N, Gutnick MJ, Fleidervish IA. Persistent sodium current in layer 5 neocortical neurons is primarily generated in the proximal axon. J Neurosci. 2006;26:3465–3473. - PMC - PubMed
    1. Barco A, Bailey CH, Kandel ER. Common molecular mechanisms in explicit and implicit memory. J Neurochem. 2006;97:1520–1533. - PubMed
    1. Bartolomei F, Gastaldi M, Massacrier A, Planells R, Nicolas S, Cau P. Changes in the mRNAs encoding subtypes I, II and III sodium channel alpha subunits following kainate-induced seizures in rat brain. J Neurocytol. 1997;26:667–678. - PubMed
    1. Bengzon J, Kokaia M, Brundin P, Lindvall O. Seizure suppression in kindling epilepsy by intrahippocampal locus coeruleus grafts: evidence for an alpha-2-adrenoreceptor mediated mechanism. Exp Brain Res. 1990;81:433–437. - PubMed

Publication types