. 2008 Oct 20;95(3):308-32.
doi: 10.1016/j.physbeh.2008.06.010. Epub 2008 Jun 29.

Preferences of 14 rat strains for 17 taste compounds

Affiliations

Preferences of 14 rat strains for 17 taste compounds

Michael G Tordoff et al. Physiol Behav. .

Abstract

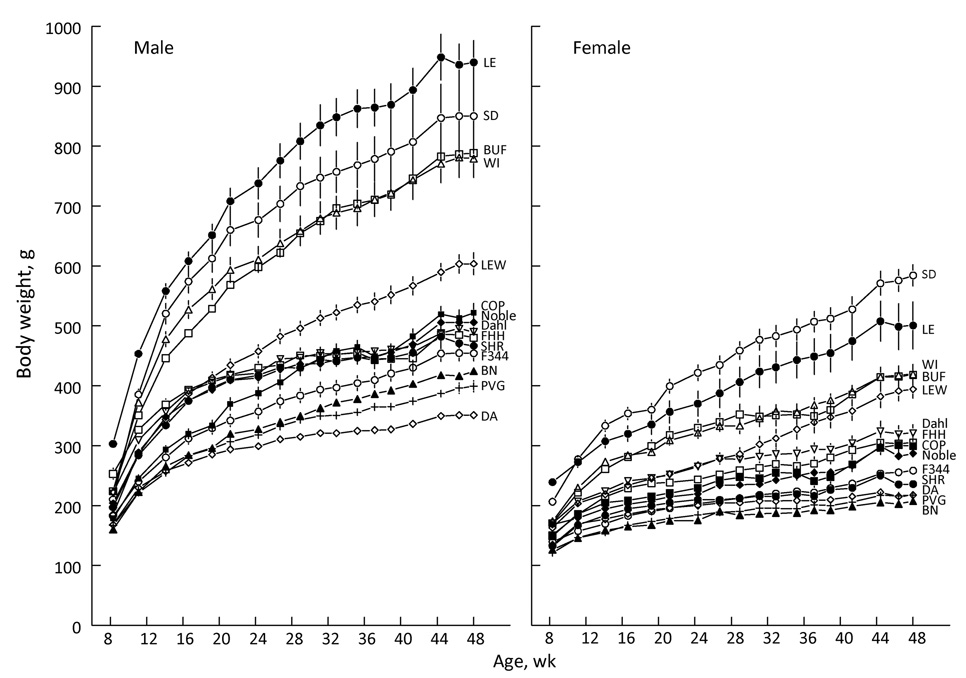
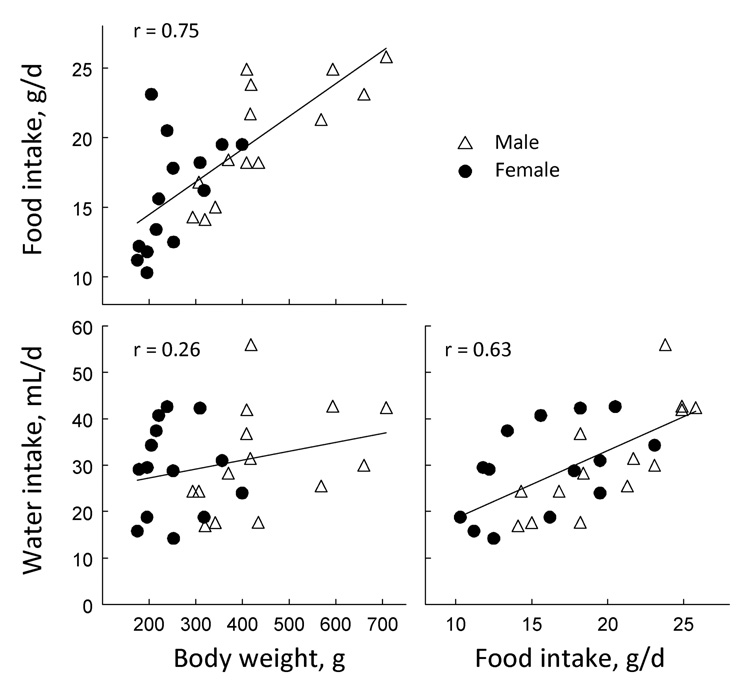
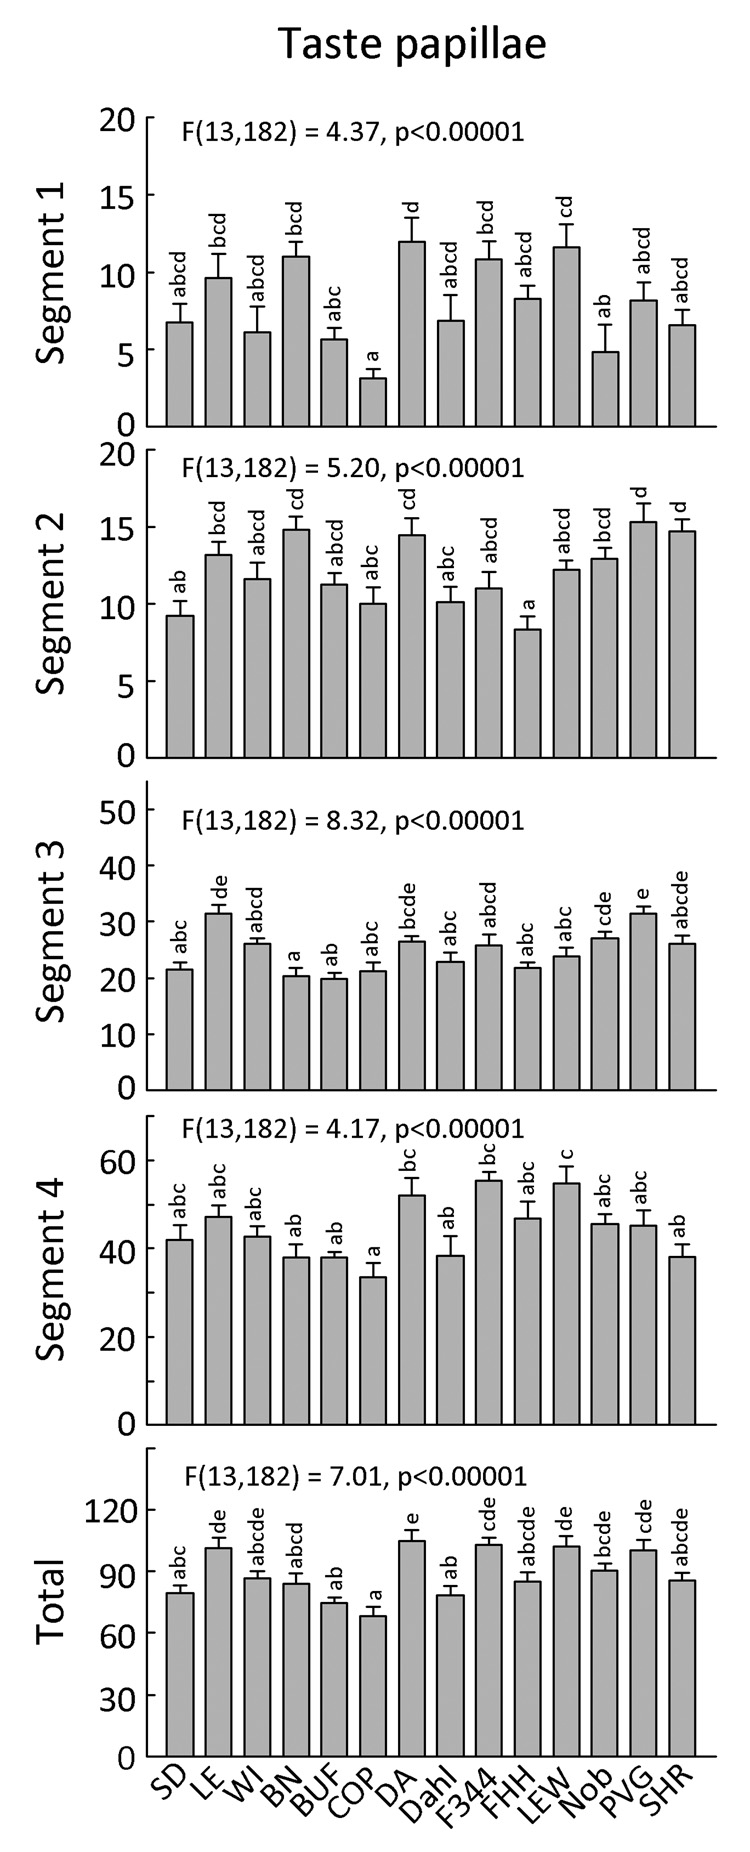
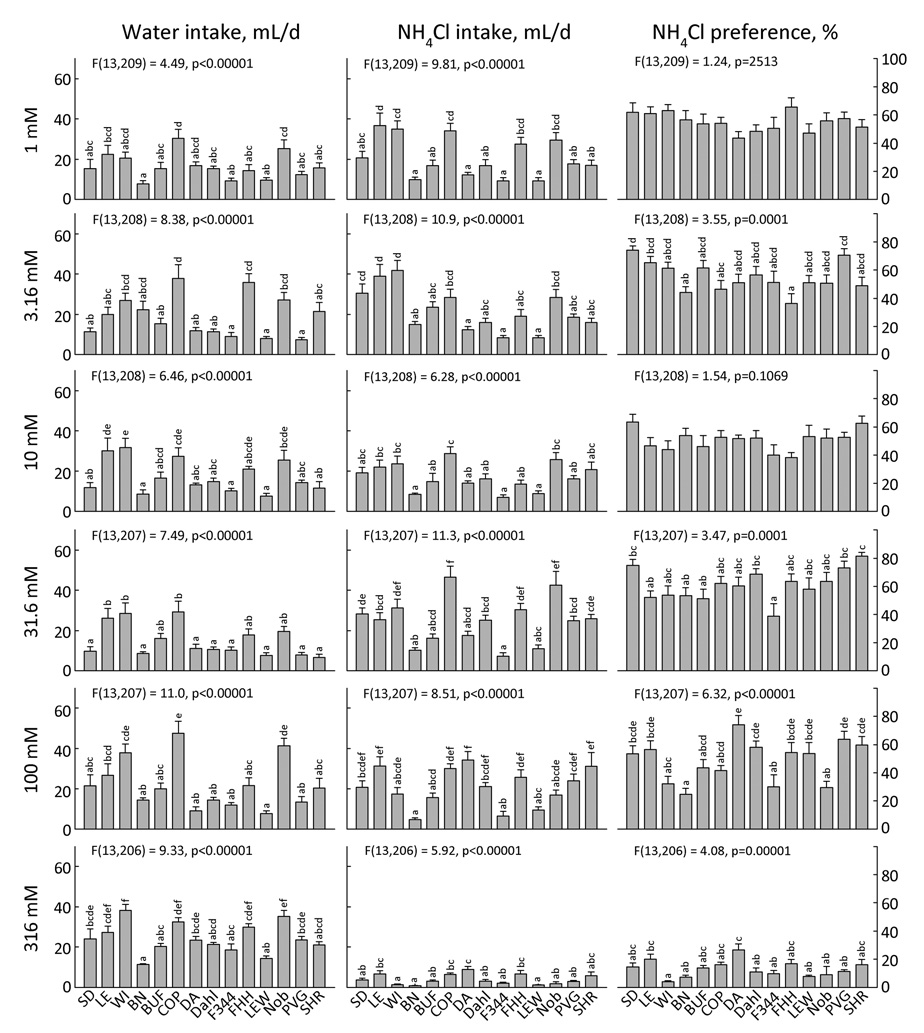
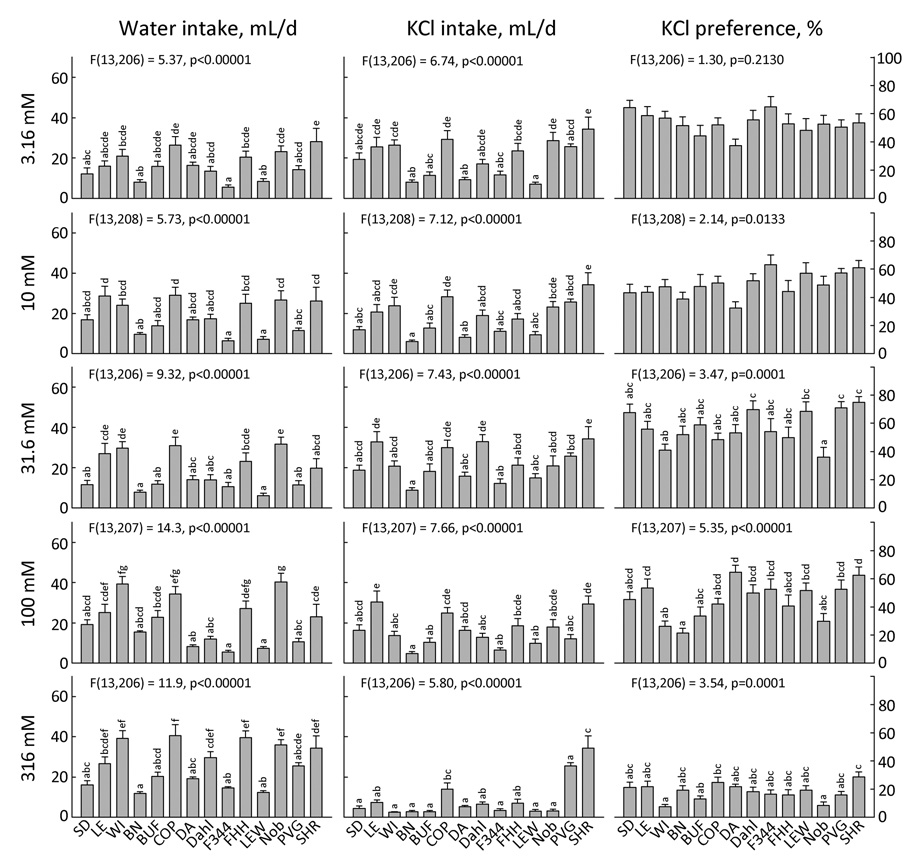
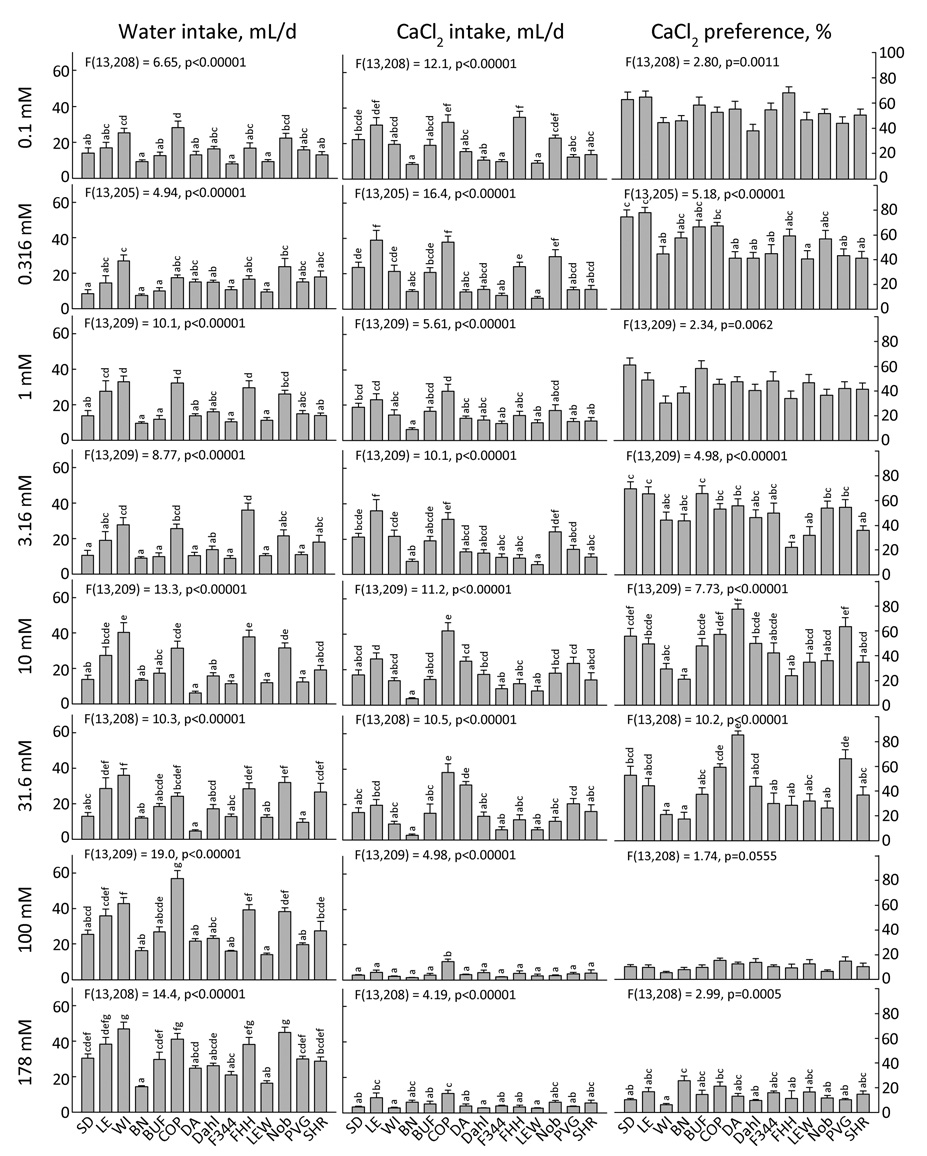
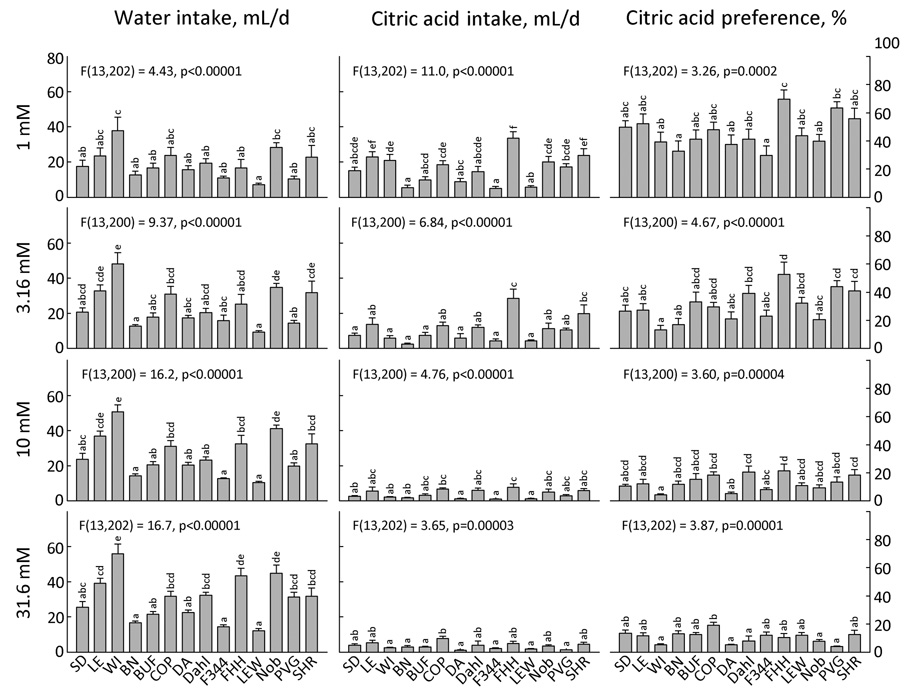
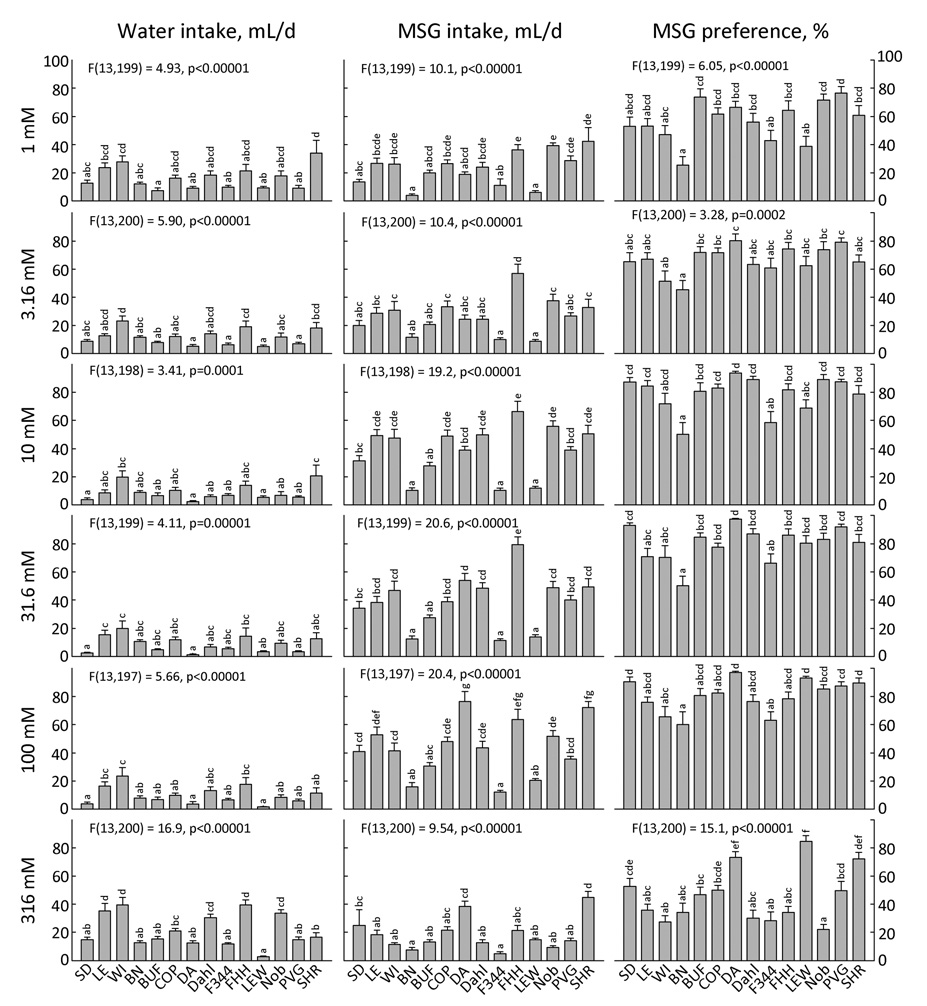
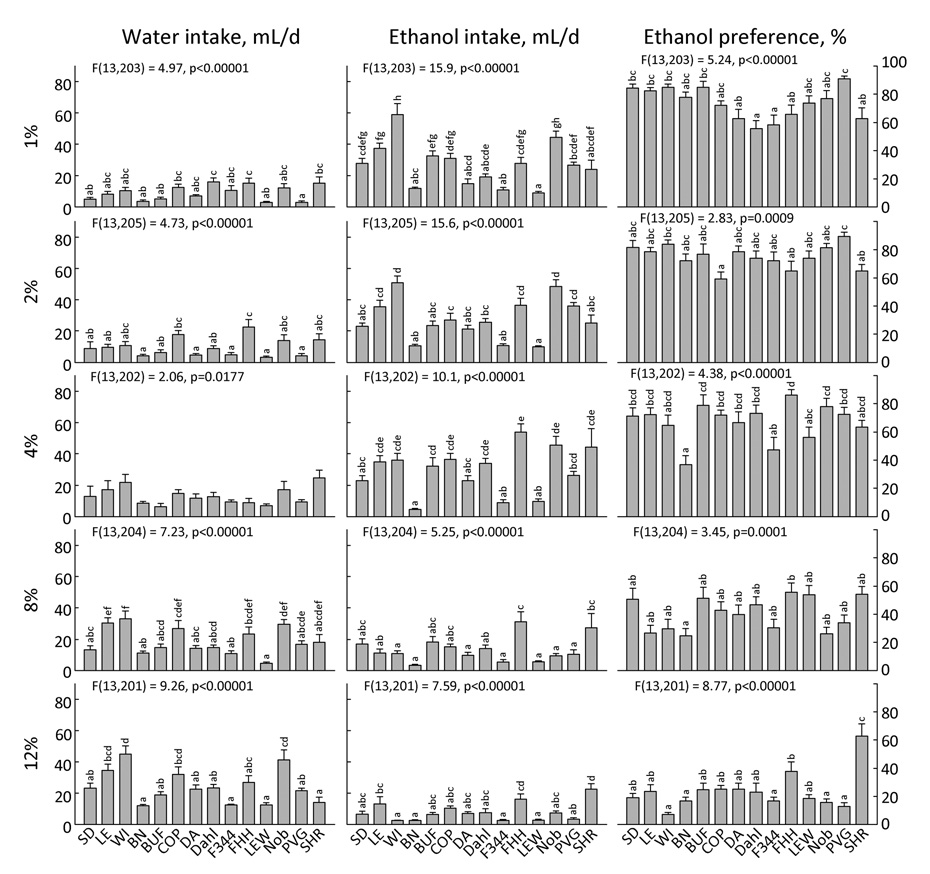
Two-bottle choice tests were used to assess the taste preferences of 8 male and 8 female rats from 3 outbred strains (SD, LE, WI) and 11 inbred strains (BN, BUF, COP, DA, Dahl-S, F344, FHH, LEW, Noble, PVG, SHR). Each rat received a series of 109 48-h tests with a choice between water and a "taste solution". Four to eight concentrations of the following compounds were tested: NaCl, CaCl2, NH4Cl, KCl, MgCl2, saccharin, sucrose, ethanol, HCl, citric acid, quinine hydrochloride (QHCl), caffeine, denatonium, monosodium glutamate (MSG), Polycose, corn oil, and capsaicin. Strain differences (p<0.001) were observed in preferences for at least one concentration of all compounds tested except denatonium (p=0.0015). There were also strain differences in the following ancillary measures: fungiform papillae number, water intake, food intake, and body weight. There were sex differences in food intake and body weight but no concerted sex differences in any of the other measures, including preferences for any taste solution. This comprehensive source of information can be used to guide the choice of appropriate rat strains and taste solution concentrations for future genetic studies.


Figures

Figure 1
Figure 1. Body weights of male and female rats of 14 strains
The rats were fed AIN-76A diet and had 17 series of two-bottle choice tests during this period.
Figure 2
Figure 2. Body weight (BW), food intake (FI) and water intake (WI) of male (left) and female (right) rats of 14 strains
Top panels show BW at end of experiment. Intakes are average of three measurements collected at age 7, 21, and 46 wk. The middle and bottom panels show FI and WI adjusted for body weight. Each bar shows the mean ± SE for each strain (n = ~8). Strains sharing the same letters above the bars did not differ significantly (p<0.001). ANOVA results in each panel refer to effect of strain. Data from males and females were treated separately.
Figure 3
Figure 3. Water intakes of rats during tests with two bottles of water to drink
Figure 4
Figure 4. Scatter plots showing the relationship between body weight, food intake, and water intake in male and female rats of 14 strains
Each symbol is the mean of ~8 rats of the same strain and sex. Food and water intake = average food intake from three trials when rats had two bottles of water available at age 8, 24, and 46 wk. Body weight = weight at 24 wk. Regression lines for both sexes combined are shown but these were very similar to those for each sex separately.
Figure 5
Figure 5. Number of fungiform taste papillae on tongue of 14 strains of rats
Separate counts for four segments are shown, from its base (Segment 1) to tip (Segment 4); the total number of papillae is given in the bottom panel. Each bar shows the mean ± SE for each strain with males and females combined. Strains sharing the same letters above the bars did not differ significantly (p<0.001). ANOVA results in each panel refer to effect of strain.
Figure 6
Figure 6. Two-bottle intake and preference for 7 concentrations of NaCl by 14 strains of rats
Each bar shows the mean ± SE for each strain with males and females combined. Strains sharing the same letters above the bars did not differ significantly (p<0.001). ANOVA results in each panel refer to effect of strain; not shown are ANOVA results for preferences for 3.16 mM NaCl, F(13,209) = 4.25, p<0.00001; 10 mM NaCl, F(13,201) = 3.82, p=0.00002; 31.6 mM NaCl, F(13,207) = 4.25, p=0.00008; 100 mM NaCl, F(13,207) = 3.03, p<0.00042; and 178 mM NaCl, F(13,209) = 8.66, p<0.00001.
Figure 7
Figure 7. Two-bottle intake and preference for 6 concentrations of NH4Cl by 14 strains of rats
Each bar shows the mean ± SE for each strain with males and females combined. Strains sharing the same letters above the bars did not differ significantly (p<0.001). ANOVA results in each panel refer to effect of strain.
Figure 8
Figure 8. Two-bottle intake and preference for 5 concentrations of KCl by 14 strains of rats
Each bar shows the mean ± SE for each strain with males and females combined. Strains sharing the same letters above the bars did not differ significantly (p<0.001). ANOVA results in each panel refer to effect of strain.
Figure 9
Figure 9. Two-bottle intake and preference for CaCl2 by 14 strains of rats
Each bar shows the mean ± SE for each strain with males and females combined. Strains sharing the same letters above the bars did not differ significantly (p<0.001). ANOVA results in each panel refer to effect of strain.
Figure 10
Figure 10. Two-bottle intake and preference for 5 concentrations of MgCl2 by 14 strains of rats
Each bar shows the mean ± SE for each strain with males and females combined. Strains sharing the same letters above the bars did not differ significantly (p<0.001). ANOVA results in each panel refer to effect of strain.
Figure 11
Figure 11. Two-bottle intake and preference for 7 concentrations of saccharin by 14 strains of rats
Each bar shows the mean ± SE for each strain with males and females combined. Strains sharing the same letters above the bars did not differ significantly (p<0.001). ANOVA results in each panel refer to effect of strain. Results for 1 mM saccharin preference, F(13,204) = 5.11, p<0.00001; 3.16 mM saccharin preference, F(13,207) = 4.07, p<0.00001 ; 31.6 mM saccharin preference, F(13,205) = 4.01, p < 0.00001.
Figure 12
Figure 12. Two-bottle intake and preference for 5 concentrations of sucrose by 14 strains of rats
Each bar shows the mean ± SE for each strain with males and females combined. Strains sharing the same letters above the bars did not differ significantly (p<0.001). ANOVA results in each panel refer to effect of strain. Results for 17.8 mM sucrose preference, F(13,204) =4.94, p<0.00001; 31.6 mM sucrose preference, F(13,207) = 6.06, p<0.00001; 56.2 mM sucrose preference, F(13,205) = 3.40, p = 0.0001, 100 mM sucrose preference, F(13,205) = 1.43, p = 0.1479.
Figure 13
Figure 13. Two-bottle intake and preference for 7 concentrations of Polycose by 14 strains of rats
Each bar shows the mean ± SE for each strain with males and females combined. Strains sharing the same letters above the bars did not differ significantly (p<0.001). ANOVA results in each panel refer to effect of strain. Results for Polycose preferences: 0.5%, F(13,196) = 2.40, p = 0.0051; 1%, F(13,196) = 2.18, p = 0.0117; 2%, F(13,195) = 1.14, p = 0.3310; 4%, F(13,195) = 0.77, p = 0.6918; 8%, F(13,194) = 1.59, p = 0.0905; 16%, F(13,193) = 2.64, p = 0.0021; 32%, F(13,193) = 6.98, p < 0.00001.
Figure 14
Figure 14. Two-bottle intake and preference for 5 concentrations of HCl by 14 strains of rats
Each bar shows the mean ± SE for each strain with males and females combined. Strains sharing the same letters above the bars did not differ significantly (p<0.001). ANOVA results in each panel refer to effect of strain.
Figure 15
Figure 15. Two-bottle intake and preference for 4 concentrations of citric acid by 14 strains of rats
Each bar shows the mean ± SE for each strain with males and females combined. Strains sharing the same letters above the bars did not differ significantly (p<0.001). ANOVA results in each panel refer to effect of strain.
Figure 16
Figure 16. Two-bottle intake and preference for 5 concentrations of quinine hydrochloride (QHCl) by 14 strains of rats
Each bar shows the mean ± SE for each strain with males and females combined. Strains sharing the same letters above the bars did not differ significantly (p<0.001). ANOVA results in each panel refer to effect of strain.
Figure 17
Figure 17. Two-bottle intake and preference for 4 concentrations of caffeine by 14 strains of rats
Each bar shows the mean ± SE for each strain with males and females combined. Strains sharing the same letters above the bars did not differ significantly (p<0.001). ANOVA results in each panel refer to effect of strain.
Figure 18
Figure 18. Two-bottle intake and preference for 4 concentrations of denatonium by 14 strains of rats
Each bar shows the mean ± SE for each strain with males and females combined. Strains sharing the same letters above the bars did not differ significantly (p<0.001). ANOVA results in each panel refer to effect of strain.
Figure 19
Figure 19. Two-bottle intake and preference for 6 concentrations of monosodium glutamate (MSG) by 14 strains of rats
Each bar shows the mean ± SE for each strain with males and females combined. Strains sharing the same letters above the bars did not differ significantly (p<0.001). ANOVA results in each panel refer to effect of strain. Results for 10 mM MSG preference, F(13,198) = 5.94, p<0.00001; 31.6 mM MSG preference, F(13,199) = 6.47, p<0.00001; 100 mM MSG preference, F(13,197) = 5.67, p<0.00001.
Figure 20
Figure 20. Two-bottle intake and preference for 5 concentrations of corn oil by 14 strains of rats
Each bar shows the mean ± SE for each strain with males and females combined. Strains sharing the same letters above the bars did not differ significantly (p<0.001). ANOVA results in each panel refer to effect of strain. Results for 1% corn oil preference, F(13,192) = 6.49, p<0.00001; 2% corn oil preference, F(13,192) = 4.33, p<0.00001; 4% corn oil preference, F(13,189) = 6.06, p<0.00001. Note that corn oil was held in suspension with 0.3% soybean phosphatidylcholine and 0.2% xanthan gum, and these were also added to the “water” bottle.
Figure 21
Figure 21. Two-bottle intake and preference for 5 concentrations of ethanol by 14 strains of rats
Each bar shows the mean ± SE for each strain with males and females combined. Strains sharing the same letters above the bars did not differ significantly (p<0.001). ANOVA results in each panel refer to effect of strain. Ethanol concentrations (shown at left) are in percent volume/volume.
Figure 22
Figure 22. Two-bottle intake and preference for 4 concentrations of capsaicin by 14 strains of rats
Each bar shows the mean ± SE for each strain with males and females combined. Strains sharing the same letters above the bars did not differ significantly (p<0.001). ANOVA results in each panel refer to effect of strain.

References

    1. Abrams M, DeFriez AIC, Tosteson DC, Landis EM. Self-selection of salt solutions and water by normal and hypertensive rats. Am. J. Physiol. 1949;156:233–241. - PubMed
    1. Aitman T. co-signatories), e. a. a. a. Progress and prospects in rat genetics: a community view. Nature Genetics. in press. - PubMed
    1. Amit Z, Smith BR. Differential ethanol intake in Tryon maze-bright and Tryon maze-dull rats: implications for the validity of the animal model of selectively bred rats for high ethanol consumption. Psychopharmacology (Berl) 1992;108:136–140. - PubMed
    1. Bachmanov AA, Beauchamp GK. Taste receptor genes. Annu Rev Nutr. 2007;27:389–414. - PMC - PubMed
    1. Bachmanov AA, Beauchamp GK, Tordoff MG. Voluntary consumption of NaCl, KCl, CaCl2 and NH4Cl solutions by 28 mouse strains. Behav. Genetics. 2002;32:445–457. - PMC - PubMed

Publication types