. 2008 Sep 19;283(38):26263-73.
doi: 10.1074/jbc.M803417200. Epub 2008 Jul 18.

Structure basis and unconventional lipid membrane binding properties of the PH-C1 tandem of rho kinases

Affiliations

Structure basis and unconventional lipid membrane binding properties of the PH-C1 tandem of rho kinases

Wenyu Wen et al. J Biol Chem. .

Abstract

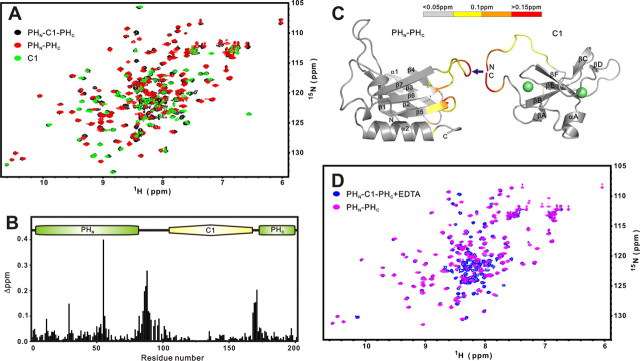
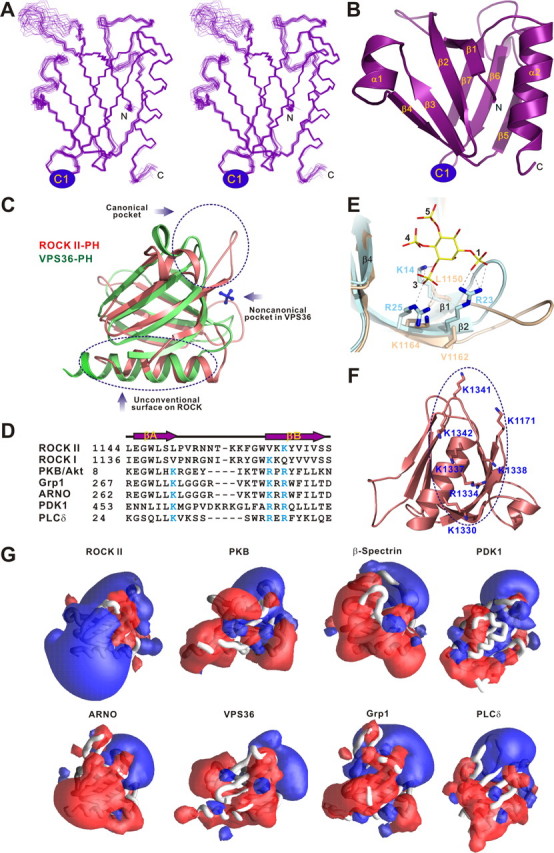
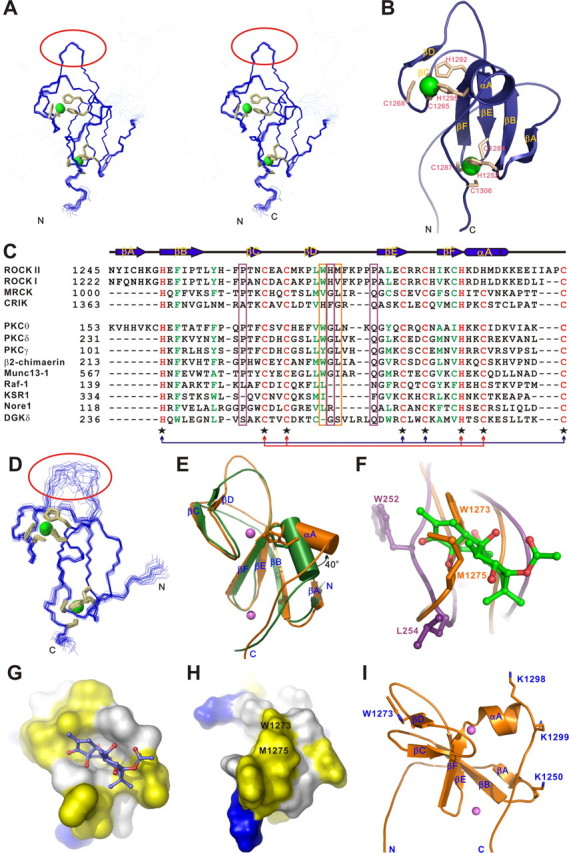
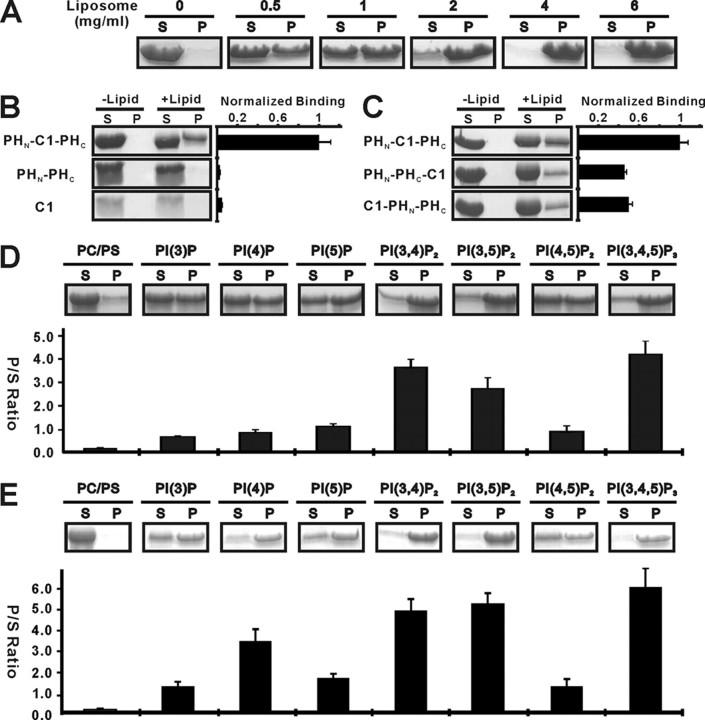
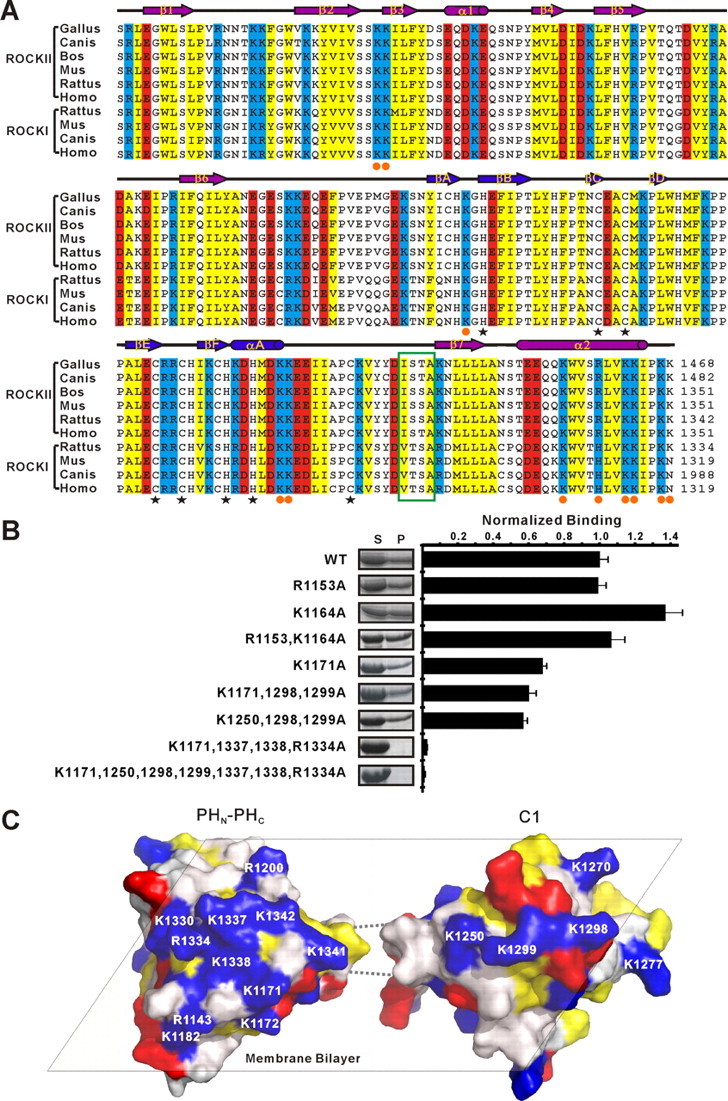
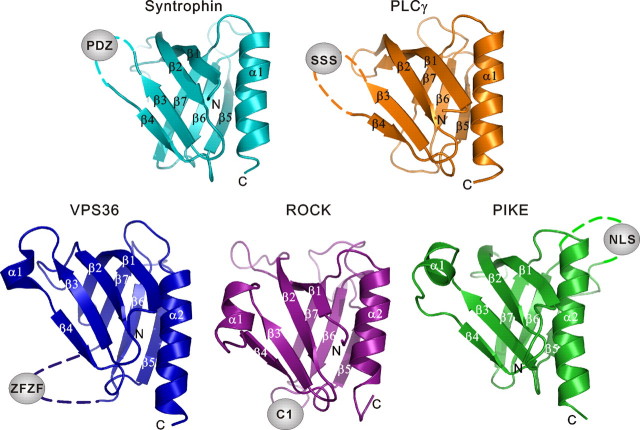
Rho kinase (ROCK), a downstream effector of Rho GTPase, is a serine/threonine protein kinase that regulates many crucial cellular processes via control of cytoskeletal structures. The C-terminal PH-C1 tandem of ROCKs has been implicated to play an autoinhibitory role by sequestering the N-terminal kinase domain and reducing its kinase activity. The binding of lipids to the pleckstrin homology (PH) domain not only regulates the localization of the protein but also releases the kinase domain from the close conformation and thereby activates its kinase activity. However, the molecular mechanism governing the ROCK PH-C1 tandem-mediated lipid membrane interaction is not known. In this study, we demonstrate that ROCK is a new member of the split PH domain family of proteins. The ROCK split PH domain folds into a canonical PH domain structure. The insertion of the atypical C1 domain in the middle does not alter the structure of the PH domain. We further show that the C1 domain of ROCK lacks the diacylglycerol/phorbol ester binding pocket seen in other canonical C1 domains. Instead, the inserted C1 domain and the PH domain function cooperatively in binding to membrane bilayers via the unconventional positively charged surfaces on each domain. Finally, the analysis of all split PH domains with known structures indicates that split PH domains represent a unique class of tandem protein modules, each possessing distinct structural and functional features.


Figures

FIGURE 1.
FIGURE 1.
Comparison of the structures of the split PH and C1 domains in the ROCK II PHN-C1-PHC tandem and in their respective isolated states. A, superposition plots of 1H, 15N HSQC spectra of the PHN-C1-PHC tandem (black), the isolated C1 domain (green), and the joint PHN-PHC domain (red). B, plot of chemical shift differences as a function of the residue number of the split PH and C1 domains in the tandem and in their respective isolated forms. The combined 1H and 15N chemical shift changes are defined as follows: Δppm = ((ΔδHN)2 + (ΔδN × αN)2)½, where ΔδHN and ΔδN represent chemical shift differences of amide proton and nitrogen chemical shifts between the PHN-C1-PHC tandem and the isolated PH and C1 domains, respectively. The scaling factor αN used to normalize the 1H and 15N chemical shifts is 0.17. The domain organization of the PHN-C1-PHC tandem is indicated at the top of the plot. C, mapping of the chemical shift changes of the PH and C1 domains onto the three-dimensional structure of each domain as a result of separating the two domains from the tandem. The coloring scheme is represented using a horizontal bar at the top. D, superposition plots of the 1H, 15N HSQC spectra of the PHN-C1-PHC tandem in the presence of 4 molar ratios of EDTA (blue) and the joint PHN-PHC domain (magenta). Figures were generated using PYMOL, MOLMOL (43), and GRASP (44).
FIGURE 2.
FIGURE 2.
Structure of the ROCK II joint PHN-PHC domain. A, stereo view showing the backbones of 20 superimposed NMR-derived structures of the joint PHN-PHC. B, ribbon diagram of a representative NMR structure of the joint PH domain. The insertion of the C1 domain in the β6/β7-loop of the split PH domain is indicated. C, structural comparison of the split PH domains from ROCK II (pink) and VPS36 (green, PDB code 2CAY). The sulfate anion (blue sticks) bound to the noncanonical pocket formed by residues from the β5/β6- and β7/α2-loops of VPS36 split PH domain is indicated. D, structure-based sequence alignment of the β1/β2-loop of the ROCK split PH domains and the β1/β2-loops from some specific lipid-binding PH domains. The basic residues from the signature phosphoinositide-binding motifs are highlighted in cyan. E, comparison of the PIP lipid head binding pocket of the PKB/Akt PH domain (cyan, PDB code 1H10) with the same region of the ROCK II PHN-PHC domain (light yellow). The critical residues of the lipid head-binding pocket are drawn using the explicit atom representation. F, residues forming the flat, positively charged surface of the ROCK II split PH domain. G, comparison of the surface electrostatic properties of the ROCK II split PH domain with those of representative phosphoinositide-binding PH domains (Btk, PDB code, 1B55; DAPP1, PDB code 1FAO; β-spectrin, PDB code 1BTN; Grp1, PDB code 1FGY; PKB/Akt, PDB code 1H10; PLCδ1, PDB code 1MAI; ARNO, PDB code 1U27; PDK1, PDB code 1W1D; VPS36, PDB code 2CAY). The PH domains are shown in worm models. Positive (blue) and negative (red) electrostatic potentials are contoured at +3 and -3 kT, respectively. The orientations of the domains are similar to that in Fig. 2C. Electrostatic potentials were calculated with GRASP (44).
FIGURE 3.
FIGURE 3.
Structure of the ROCK II C1 domain. A, stereo view plot of 20 superimposed NMR structures of the isolated C1 domain. The cysteine and histidine residues involved in the Zn2+ coordination are shown as orange sticks, and the two Zn2+ ions are depicted as green spheres. The rigid βD/βE-loop is highlighted with a red circle. B, ribbon diagram drawing of the C1 domain structure. C, amino acid sequence alignment of the C1 domains of the ROCK family kinases (upper panel) and the structurally based sequence alignment of all C1 domains with known structures (lower panel). The absolutely conserved amino acids are shown in red, the highly conserved residues in green, and the variable residues in black. The residues involved in Zn2+ binding are indicated with black star below the sequences. The two sets of Zn2+-binding motifs are highlighted with arrows colored red and blue, respectively. The residues in the position homologous to Pro-241, Gly-253, and Gln-257 of PKCδ are highlighted with a purple box, and the residues in the positions homologous to Trp-1273 and Met-1275 of ROCK II are highlighted with an orange box. D, superimposed NMR structures of the C1A domain of PKCθ (PDB code 2ENN). The flexible βD/βE-loop is highlighted with a red circle. E, structure comparison of the C1 domains from ROCK II (orange) and PKCθ (green). The α-helix is shown as cylinder. The side chains of the two discriminating residues in the CCHC- and CCHH-type zinc fingers are also shown. F, close-up view of the potential DAG/phorbol ester-binding sites in ROCK II C1 domain (orange) and the interaction of PKCδ C1B domain with phorbol ester (purple, PDB code 1PTR). The phorbol ester is shown as green sticks. G, surface diagram of the PKCθ C1B domain. The orientation of the C1B domain is similar to that in Fig. 3F. The positively charged amino acids are highlighted in blue, the negatively charged residues in red, the hydrophobic residues in yellow, and the others in white. The phorbol ester is shown in sticks. H, surface diagram of the ROCK II C1 domain. The orientation of the C1 domain is similar to that in Fig. 3F. The hydrophobic Trp-1273 and Met-1275 that occlude phorbol ester from binding to the domain are labeled. I, several basic residues are clustered at one side of the ROCK II C1 domain.
FIGURE 4.
FIGURE 4.
The PHN-C1-PHC supramodule binds to lipid with enhanced avidity. A, dose-dependent binding between the ROCK II PHN-C1-PHC tandem and liposomes prepared from bovine brain lipid extracts. In this assay, the amount of the PHN-C1-PHC tandem is fixed at 12.5 μm, and the concentration of liposome varies. S and P denote proteins recovered in the supernatants and pellets, respectively, in the centrifugation-based liposome binding assays. B, comparison of the brain liposome bindings of the ROCK II PHN-C1-PHC tandem and its isolated domains. The concentration of liposome was fixed at 0.75 mg/ml in the assay. The right panel shows the quantitation of the binding assays. C, binding of the two mutants of the ROCK II PHN-C1-PHC tandem to the brain liposomes. In these two mutants, the C1 domain was placed either at the front (C1-PHN-PHC) or after (PHN-PHC-C1) the split PH domain. D, interactions of ROCK II PHN-C1-PHC tandem with various PIPs (5%) reconstituted into the defined PC/PS (75/20%) liposomes assayed by the sedimentation method. The ratio of proteins recovered in the pellet and supernatant in each assay is also plotted. E, interaction of ROCK I PHN-C1-PHC tandem with various PIPs (5%) reconstituted into the defined PC/PS (75/20%) liposomes assayed by the same sedimentation method. In the graphed plots, all measured bindings are means ± S.D. of at least three different experiments.
FIGURE 5.
FIGURE 5.
The ROCK II split PH and C1 domains function cooperatively in binding to membrane bilayers. A, amino acid sequence alignment of the PHN-C1-PHC tandem of the mammalian ROCK family proteins. In this alignment, the conserved positively charged amino acids are highlighted in blue, the negatively charged residues in red, and the hydrophobic residues in yellow. The cysteine and histidine residues involved in Zn2+ binding are indicated with black star below the sequences. The basic residues forming the positively charged surfaces shown in C are indicated with orange circles. The 4 residues linking the rigid C-terminal end of the C1 domain and theβ7-strand of the PH domain are highlighted with a green box. B, sedimentation-based liposome binding assay investigating the roles of the basic residues from the potential lipid binding surfaces of the PH and C1 domains in lipid membrane binding. The concentration of liposome was fixed at 0.75 mg/ml in the assay. The right panel shows the quantitation of the assay. The measured bindings are mean ± S.D. of at least three different experiments. WT, wild type. C, model showing the potential synergetic actions of the split PH and the C1 domains in the PHN-C1-PHC supramodule in binding to membranes.
FIGURE 6.
FIGURE 6.
Structural comparison of the known split PH domains. All split PH domains with known structures adopt canonical PH domain folds. For syntrophin and PLCγ, the domain splitting insertions are located in the β3/β4-loop; for VPS36 and ROCK, the domain insertions fall in the β6/β7-loop; and the domain insertion of PIKE is located in the β5/β6-loop.

Similar articles

Cited by

References

    1. Yan, J., Wen, W., Xu, W., Long, J. F., Adams, M. E., Froehner, S. C., and Zhang, M. (2005) EMBO J. 24 3985-3995 - PMC - PubMed
    1. Wen, W., Yan, J., and Zhang, M. (2006) J. Biol. Chem. 281 12060-12068 - PubMed
    1. Teo, H., Gill, D. J., Sun, J., Perisic, O., Veprintsev, D. B., Vallis, Y., Emr, S. D., and Williams, R. L. (2006) Cell 125 99-111 - PubMed
    1. Yan, J., Wen, W., Chan, L. N., and Zhang, M. (2008) J. Mol. Biol. 378 425-435 - PubMed
    1. DeBell, K., Graham, L., Reischl, I., Serrano, C., Bonvini, E., and Rellahan, B. (2007) Mol. Cell. Biol. 27 854-863 - PMC - PubMed

Publication types

LinkOut - more resources