. 2008 Oct 31;283(44):30421-32.
doi: 10.1074/jbc.M708921200. Epub 2008 Jul 18.

Identification of an evolutionarily conserved extracellular threonine residue critical for surface expression and its potential coupling of adjacent voltage-sensing and gating domains in voltage-gated potassium channels

Affiliations

Identification of an evolutionarily conserved extracellular threonine residue critical for surface expression and its potential coupling of adjacent voltage-sensing and gating domains in voltage-gated potassium channels

Lynn Mckeown et al. J Biol Chem. .

Abstract

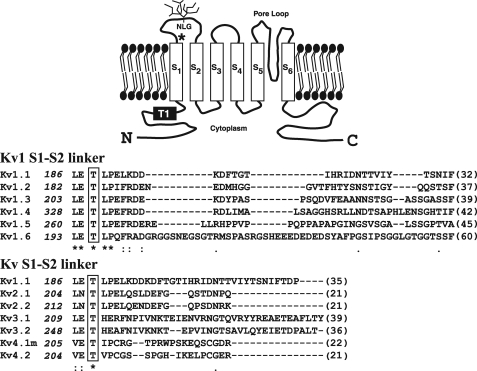
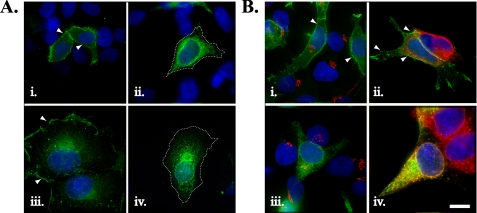
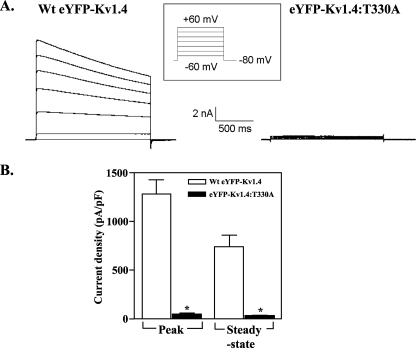
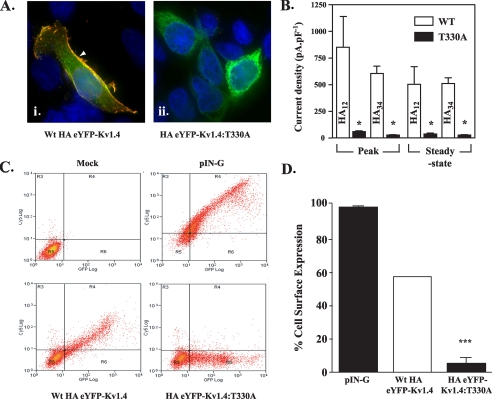
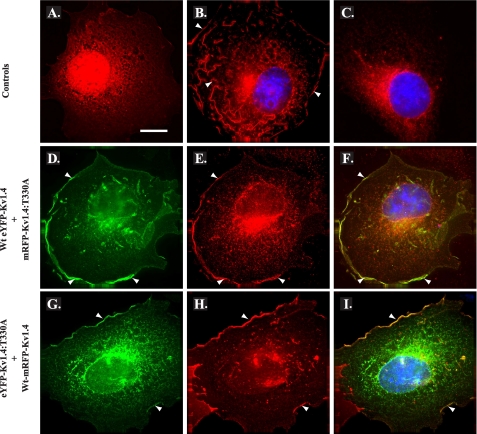
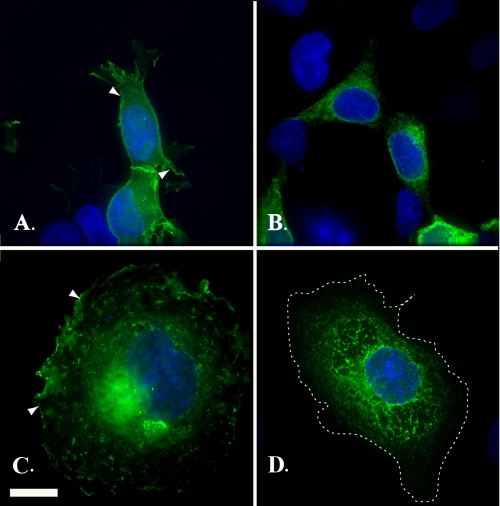
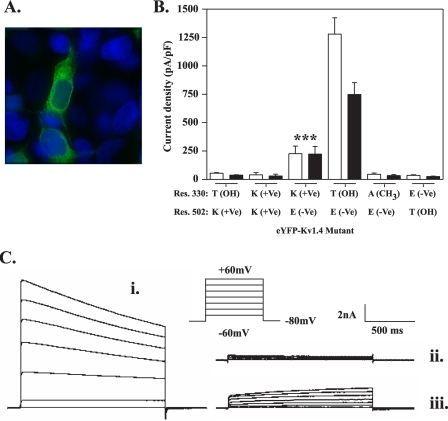
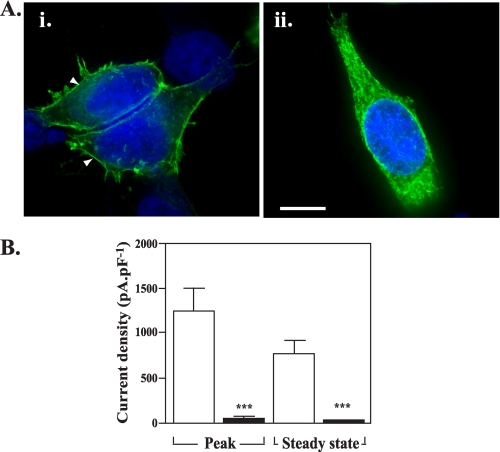
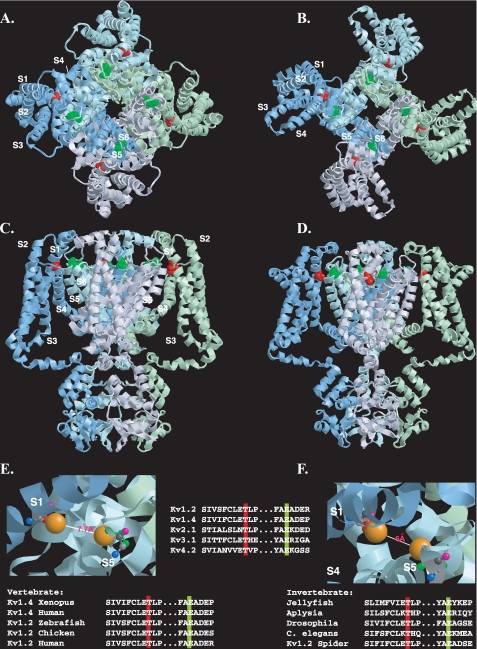
The dynamic expression of voltage-gated potassium channels (Kvs) at the cell surface is a fundamental factor controlling membrane excitability. In exploring possible mechanisms controlling Kv surface expression, we identified a region in the extracellular linker between the first and second of the six (S1-S6) transmembrane-spanning domains of the Kv1.4 channel, which we hypothesized to be critical for its biogenesis. Using immunofluorescence microscopy, flow cytometry, patch clamp electrophysiology, and mutagenesis, we identified a single threonine residue at position 330 within the Kv1.4 S1-S2 linker that is absolutely required for cell surface expression. Mutation of Thr-330 to an alanine, aspartate, or lysine prevented surface expression. However, surface expression occurred upon co-expression of mutant and wild type Kv1.4 subunits or mutation of Thr-330 to a serine. Mutation of the corresponding residue (Thr-211) in Kv3.1 to alanine also caused intracellular retention, suggesting that the conserved threonine plays a generalized role in surface expression. In support of this idea, sequence comparisons showed conservation of the critical threonine in all Kv families and in organisms across the evolutionary spectrum. Based upon the Kv1.2 crystal structure, further mutagenesis, and the partial restoration of surface expression in an electrostatic T330K bridging mutant, we suggest that Thr-330 hydrogen bonds to equally conserved outer pore residues, which may include a glutamate at position 502 that is also critical for surface expression. We propose that Thr-330 serves to interlock the voltage-sensing and gating domains of adjacent monomers, thereby yielding a structure competent for the surface expression of functional tetramers.


Figures

FIGURE 1.
FIGURE 1.
Identification of conserved residues in the S1-S2 linker of the Kv family. Upper panel, schematic diagram of the predicted membrane topology for a Kv1 family subunit, including the N-linked glycosylation (NLG) site found in the Kv1.4 S1-S2 linker and the T1 domain required for tetramerization. The asterisk denotes conserved threonine (residue 330 in Kv1.4). Lower panel, ClustalW sequence alignment of the S1-S2 extracellular linker of the rat Kv1 family and further alignment of other Kv families (beginning from the proposed last residue (leucine (L) or equivalent, numbered at left) emerging from the S1 transmembrane domain. Conserved residues are shown by asterisks with the conserved threonine boxed. Numbers in parentheses indicate the lengths of each S1-S2 linker. All sequences are from rat except Kv4.1, which is from mouse. (Evolutionary conservation of the S1-S2 linker region is shown in Fig. 9).
FIGURE 2.
FIGURE 2.
Subcellular distribution of WT eYFP-Kv1.4 and eYFP-Kv1.4:T330A determined by fluorescence imaging. A, comparison of expression of WT eYFP-Kv1.4 (i and iii) and eYFP HA-Kv1.4:T330A (ii and iv) channels in HEK293 cells (i and ii) and COS-7 cells (iii and iv). Arrowheads denote surface expression, and dashes in ii and iv indicate cell margins (determined via image overenhancement). Cells were transiently transfected, fixed, and viewed under a ×100 objective using a DeltaVision work station. B, comparison of distribution of WT eYFP-Kv1.4 (i and ii) or eYFP HA-Kv1.4:T330A (iii and iv) channels in the Golgi apparatus (i and iii) and ER (ii and iv). HEK293 cells were transiently transfected and, after 48 h, were fixed, permeabilized, and treated with antibodies raised against marker proteins of the Golgi apparatus (anti-GM130) or the ER (anti-calnexin) with subsequent detection using appropriate Cy3-conjugated secondary antibody. Green, eYFP fluorescence; blue, DAPI (nuclei); red, Cy3 secondary antibody. Areas of red/green overlap are shown in yellow. Scale bar, 15 μm.
FIGURE 3.
FIGURE 3.
Heterologous expression of functional WT eYFP-Kv1.4 and eYFP-Kv1.4:T330A channels. A, representative traces of whole-cell currents evoked in WT eYFP-Kv1.4 and eYFP-Kv1.4:T330A-transfected HEK293 cells. Whole-cell currents were recorded by patch clamp electrophysiology in response to 20-mV voltage steps between -60 and +60 mV from a holding potential of -80 mV as described under “Experimental Procedures.” B, Mean ± S.E. data of peak and steady-state currents (measured at the end of the voltage step) at +60 mV normalized to cell capacitance.
FIGURE 4.
FIGURE 4.
Surface levels of HA-tagged eYFP-Kv1.4:T330A are reduced compared with HA-tagged WT eYFP-Kv1.4. A, imaging reveals surface localization (arrowheads) of WT HA12-eYFP-Kv1.4 (i) and ER localization of HA12-eYFP-Kv1.4:T330A (ii). Live, transiently transfected HEK293 cells were labeled, at 48 h post-transfection with anti-HA antibody to detect surface channels prior to fixation and detection with a Cy3-conjugated secondary antibody. Green, eYFP fluorescence; red, Cy3 secondary antibody; blue, DAPI (nuclei) stain. Scale bar corresponds to 15 μm. B, patch clamp recordings show reduction in surface expression of HA-eYFP-Kv1.4:T330A versus WT HA-eYFP-Kv1.4 channels, which is independent of the location of the HA tag. Whole-cell currents were evoked in cells transfected with WT HA-eYFP-Kv1.4 or eYFP-Kv1.4:T330A mutants bearing the HA epitope tag in either the S1-S2 (HA12-eYFP-Kv1.4:T330A) or S3-S4 (HA34-eYFP-Kv1.4:T330A) linkers. Cells were held at a potential of -80 mV and currents measured in response to 20-mV voltage steps between -60 and +60 mV. Mean ± S.E. data of peak and steady-state currents (measured at the end of the voltage step) at +60 mV normalized to cell capacitance. Asterisks, p < 0.05, Tukey. C, quantitation of surface expression through FACS. Following surface labeling with anti-HA (primary) and Cy5 (secondary) antibody, mock-transfected control HEK293 cells (upper left panel) show low background fluorescence (log scale) in red (Cy5, surface; ordinate) and green (eYFP; abscissa) channels (defined as background, quadrant R5). Transfection with an HA- and GFP-tagged membrane marker (pIN-G) (23) (positive control; upper right panel), WT HA34-eYFP-Kv1.4 (lower left panel), or HA34-eYFP-Kv1.4:T330A (lower right panel) revealed a cell population displaying fluorescence in red and green channels (quadrant R4). Note size of population in quadrant R6 (low red (surface) fluorescence) for cells transfected with HA-eYFP-Kv1.4:T330A. D, comparison of HA34-eYFP-Kv1.4: T330A and WT HA34-eYFP-Kv1.4 surface expression determined by FACS. Data were determined from the ratio of surface to total population fluorescence (i.e. R4/(R4 + R6)) and normalized to the WT HA34-tagged channel (100%). A significant difference (n > 3, p < 0.05; Student-Newman-Keuls test) was observed between the WT and T330A mutants.
FIGURE 5.
FIGURE 5.
Co-expression with WT channels promotes surface expression of T330A mutant channel subunits. COS-7 cells transiently transfected with mRFP (red; control) (A), WT mRFP-Kv1.4 (red; WT control) (B), or mRFP-Kv1.4:T330A (red; T:A mutant, control) (C) demonstrate a distribution similar to their eYFP-tagged counterparts (see Fig. 2). D and E, co-expression of WT eYFP-Kv1.4 (D) (green) and mRFP-Kv1.4:T330A (E) (red) promotes relocation of T:A mutant channel subunits to the cell surface consistent with formation of WT:mutant heterotetramers and WT rescue. F, merged images D and E; areas of red/green overlap are shown in yellow. G and H, reciprocal co-expression of eYFP-Kv1.4:T330A (G) (green) and WT mRFP-Kv1.4 (H) (red), again commensurate with heterotetramerization and WT rescue of ER-localized channel subunits. I, merged images G and H; areas of red/green overlap are shown in yellow. Blue, DAPI (nuclei). Arrowheads denote surface expression. Cells were transiently transfected and, after 48 h, were fixed, permeabilized, and subjected to immunocytochemistry (“Experimental Procedures”). Scale bar, 15 μm. (See also supplemental Fig. S2.)
FIGURE 6.
FIGURE 6.
Mutations of threonine to either a serine (eYFP-Kv1.4:T330S) or an aspartic acid (eYFP-Kv1.4:T330D) indicate a requirement for a hydroxyl group. HEK293 cells (A and B) and COS-7 cells (C and D) transiently expressing eYFP-Kv1.4:T330S (A and C) or eYFP-Kv1.4:T330D (B and D) were fixed at 48 h post-transfection and viewed under a ×100 objective using a DeltaVision work station. Green, eYFP fluorescence; blue, DAPI (nuclei). Scale bar, 15 μm.
FIGURE 7.
FIGURE 7.
A T330K mutant engineered as a potential electrostatic bridge to Glu-502 in the S5-S6 linker shows partial surface expression. A, replacement of Glu-502 with valine causes retention in the endoplasmic reticulum. HEK293 cells were transfected with mutant eYFP-Kv1.4:E502K (green) and after 48 h fixed and viewed under a ×100 objective using a DeltaVision work station as described under “Experimental Procedures.” B, comparison of the surface expression of eYFP-Kv1.4 channels mutated at positions 330 and/or 502 determined by patch clamp electrophysiology. Peak (open bars) and steady-state (filled bars) current densities were obtained from at least five cells transfected with the indicated constructs. Data are shown as mean ± S.E. data of peak and steady-state currents (measured at the end of the voltage step) at +60 mV normalized to cell capacitance. Asterisk, p < 0.005, analysis of variance, with Student-Newman-Keuls correction compared with both WT and all other indicated mutants. For each construct, residues are shown using standard amino acid nomenclature. Parentheses denote nature of side chain as follows: +Ve, cationic; -Ve, anionic; CH3, uncharged; OH, hydrogen bond donor. The WT channel is indicated in bars 7 and 8. Note the partial expression of the T330K mutant (bars 5 and 6). C, representative traces of whole-cell currents evoked in WT eYFP-Kv1.4- (i), eYFP-Kv1.4: T330A- (ii), and eYFP-Kv1.4:T330K-transfected HEK293 cells. Whole-cell currents were recorded by patch clamp electrophysiology in response to 20-mV voltage steps between -60 and +60 mV from a holding potential of -80 mV as described under “Experimental Procedures.” Note the absence of inactivation in the eYFP-Kv1.4: T330K mutant (iii) compared with WT (i). ***, p < 0.005.
FIGURE 8.
FIGURE 8.
The requirement of Thr-330 for surface expression extends to other Kv families. A, HEK293 cells transiently expressing WT eYFP-Kv3.1 (i) or eYFP-Kv3.1:T211A (ii) were fixed at 48 h post-transfection and subjected to fluorescence imaging to determine their subcellular distribution (green, eYFP). Arrowheads denote surface expression. Scale bar, 15 μm. B, mean ± S.E. data of peak and steady-state currents (measured at the end of the voltage step) at +60 mV normalized to cell capacitance.
FIGURE 9.
FIGURE 9.
Disposition of the conserved threonine residue within the resting and open state structural models of Kv1.2. A-D, view of the Kv1.2 tetramer in resting (A and C) and open (B and D) state models (7) shown from the extracellular side of the membrane (A and B) or from the side of the membrane (C and D). For clarity, each subunit monomer has been assigned a separate color and displayed schematically. Transmembrane-spanning regions are labeled S1-S6. The conserved threonine (Thr-184) and glutamate (Glu-350) residues (corresponding to Thr-330 and Glu-502 in Kv1.4), are colored red and green, respectively. E and F, close-up view of the putative interlocking region, showing Thr-184 and Glu-350 in ball-and-stick representation for resting (E) and open (F) state models, with side chains (Thr-184, red; Glu-350, green) extended but no α-chain rotation. Oxygen atoms involved in potential hydrogen bonding are shown in orange. Backbone nitrogen, carbonyl oxygen, andα andβ carbons are denoted in blue, pink, light gray, and dark gray, respectively. Top inset, disposition of transmembrane regions colored as follows: S1, yellow; S2, orange; S3, purple; S4, pink; S5, green; S6, blue. Lower insets, evolutionary conservation of the extracellular threonine and glutamate residues colored according to the scheme described in A-D. Modeling was done using RasTop, a Windows interface to RasMol 2.62 (originally written by Roger Sayle). Structural coordinates for the resting and open state were obtained from the supplementary data given in Ref. and correspond to a refinement of the original Kv1.2 crystal structure (6, 21) using the Rosetta-Membrane method and molecular dynamics simulations.

References

    1. Gutman, G. A., Chandy, K. G., Grissmer, S., Lazdunski, M., Mckinnon, D., Pardo, L. A., Robertson, G. A., Rudy, B., Sanguinetti, M. C., Stühmer, W., and Wang, X. (2005) Pharmacol. Rev. 57 473-508 - PubMed
    1. Lai, H. C., and Jan, L.Y. (2006) Nat. Neurosci. 7 548-562 - PubMed
    1. Delisle, B. P., Anson, B. D., Rajamani, S., and January, C. T. (2004) Circ. Res. 94 1418-1428 - PubMed
    1. Manganas, L. N., Akhtar, S., Antonucci, D. E., Campomanes, C. R., Dolly, J. O., and Trimmer, J. S. (2001) J. Biol. Chem. 276 49427-49434 - PubMed
    1. Ottschytsch, N., Raes, A., Van Hoorick, D., and Snyders, D. J. (2002) Proc. Natl. Acad. Sci. U. S. A. 99 7986-7991 - PMC - PubMed

LinkOut - more resources