

Molecular dynamics simulation of the neuroglobin crystal: comparison with the simulation in solution
- PMID: 18641072
- PMCID: PMC2567928
- DOI: 10.1529/biophysj.108.135855
Molecular dynamics simulation of the neuroglobin crystal: comparison with the simulation in solution
Abstract
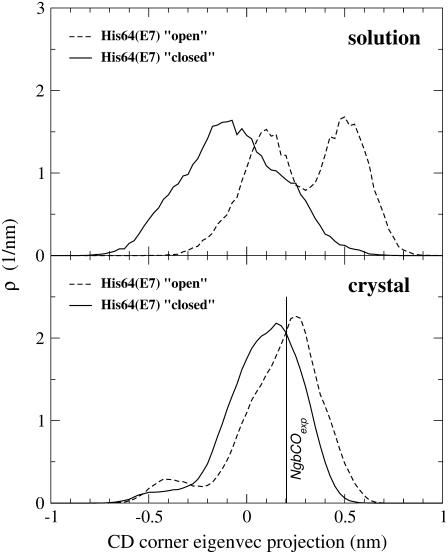
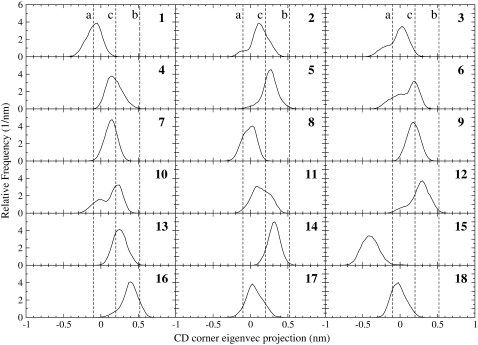
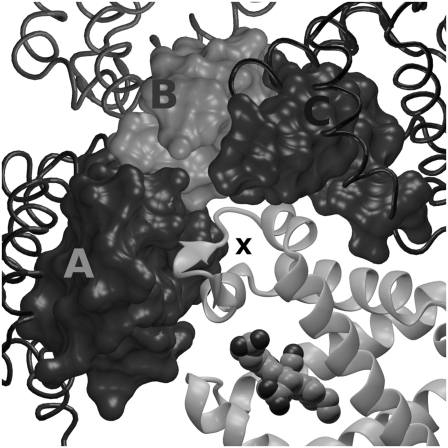
Neuroglobin (Ngb) is a monomeric protein that, despite the small sequence similarity with other globins, displays the typical globin fold. In the absence of exogenous ligands, the ferric and the ferrous forms of Ngb are both hexacoordinated to the distal and proximal histidines. In the ferrous form, oxygen, nitric oxide or carbon monoxide can displace the distal histidine, yielding a reversible adduct. Crystallographic data show that the binding of an exogenous ligand is associated to structural changes involving heme sliding and a topological reorganization of the internal cavities. Molecular dynamics (MD) simulations in solution show that the heme oscillates between two positions, much as the ones observed in the crystal structure, although the occupancy is different. The simulations also suggest that ligand binding in solution can affect the flexibility and conformation of residues connecting the C and D helices, referred to as the CD corner, which is coupled to the configuration adopted by the distal histidine. In this study, we report the results of 30 ns MD simulations of CO-bound Ngb in the crystal. Our goal was to compare the protein dynamical behavior in the crystal with the results supplied by the previous MD simulation of CO-bound Ngb in solution and the x-ray experimental data. The results show that the different environments (crystal or solution) affect the dynamics of the heme group and of the CD corner.
Figures
References
-
- Burmester, T., B. Weich, S. Reinhardt, and T. Hankeln. 2000. A vertebrate globin expressed in the brain. Nature. 407:520–523. - PubMed
-
- Dewilde, S., L. Kiger, T. Burmester, T. Hankeln, V. Baudin-Creuza, T. Aerts, M. C. Marden, R. Caubergs, and L. Moens. 2001. Biochemical characterization and ligand binding properties of neuroglobin, a novel member of the globin family. J. Biol. Chem. 276:38949–38955. - PubMed
-
- Pesce, A., S. Dewilde, M. Nardini, L. Moens, P. Ascenzi, T. Hankeln, T. Burmester, and M. Bolognesi. 2003. Human brain neuroglobin structure reveals a distinct mode of controlling oxygen affinity. Structure. 11:1087–1095. - PubMed
-
- Nienhaus, K., J. M. Kriegl, and G. U. Nienhaus. 2004. Structural dynamics in the active site of murine neuroglobin and its effects on ligand binding. J. Biol. Chem. 279:22944–22952. - PubMed
-
- Vallone, B., K. Nienhaus, M. Brunori, and G. U. Nienhaus. 2004. The structure of murine neuroglobin: novel pathways for ligand migration and binding. Proteins. 56:85–92. - PubMed
Publication types
MeSH terms
Substances
LinkOut - more resources
Full Text Sources
Miscellaneous
